PowerPoint Infographic Template Collection
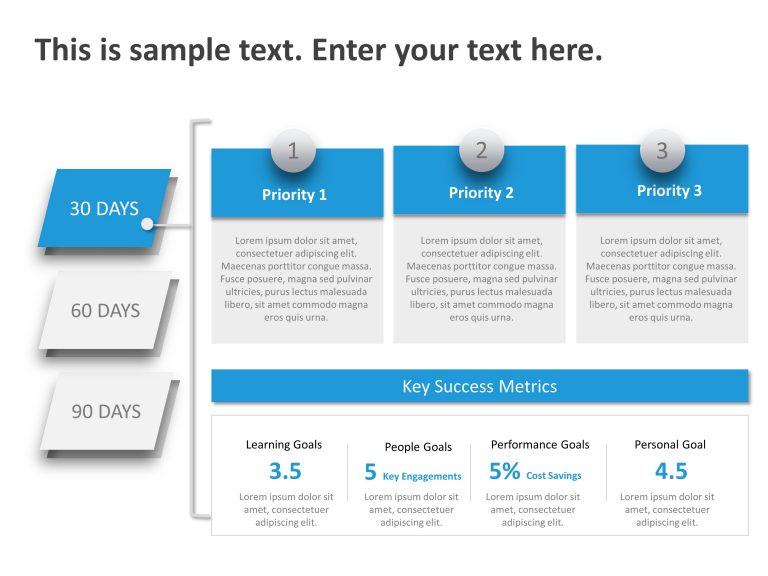
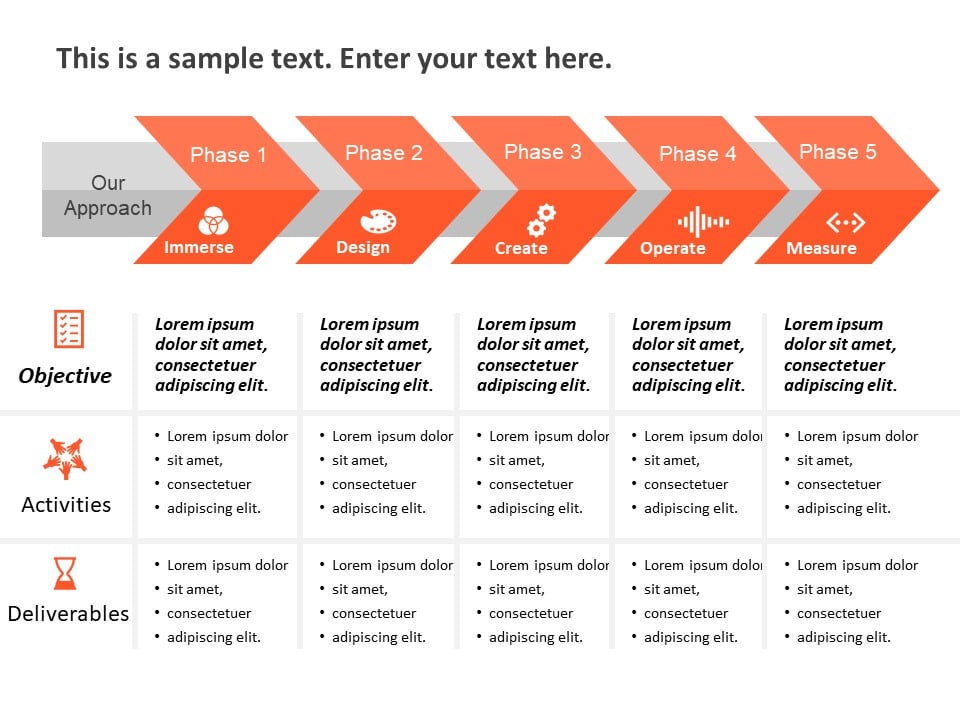
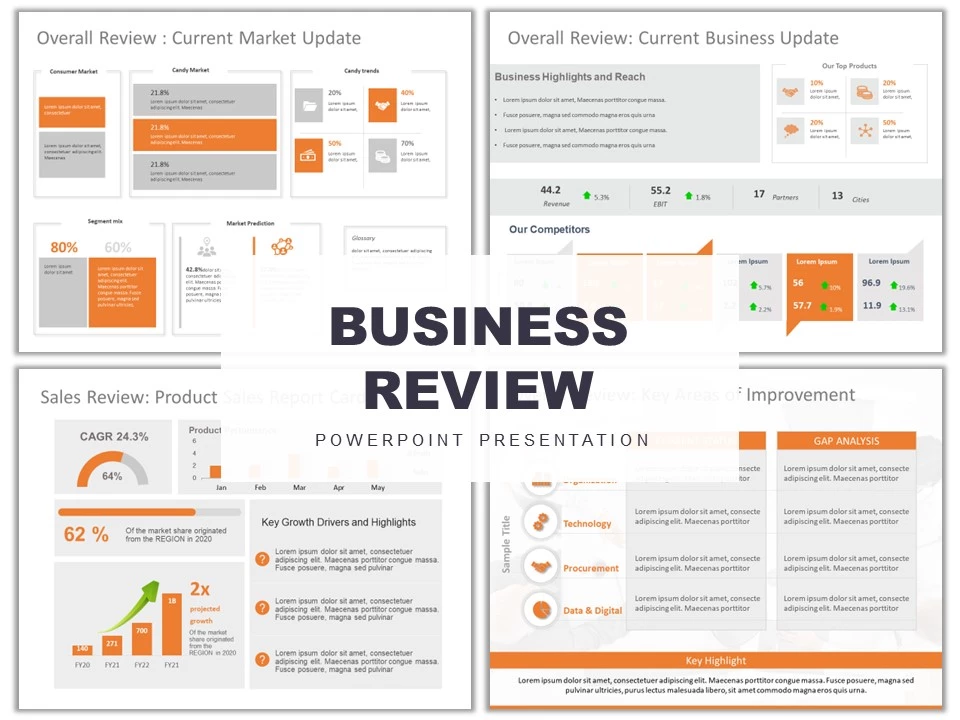
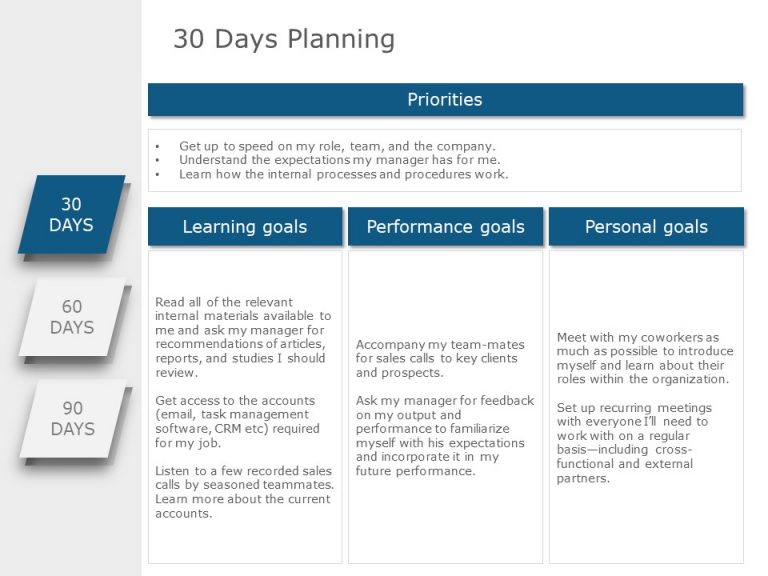
Business professionals to college students, everyone can use our infographic PPT templates. These infographics presentation templates seamlessly blend data visualization and creative design elements. With a vast collection of visually striking graphs, pie charts, icons, flow charts, and illustrations, these infographics for PowerPoint and Google Slides presentations allow you to transform complex information into understandable visuals.
Use our best PowerPoint infographics templates to take your data-driven storytelling to new heights. Deliver impactful presentations with SlideUpLift’s PowerPoint and Google Slides infographic templates that leave a lasting impression on your audience.
What are infographics for PowerPoint?
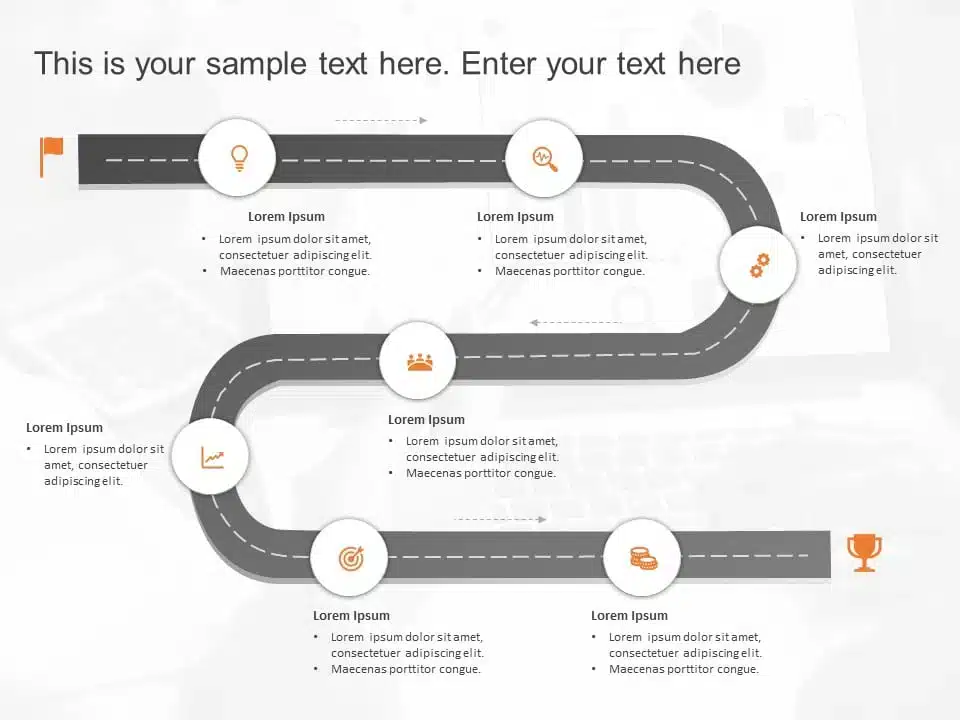
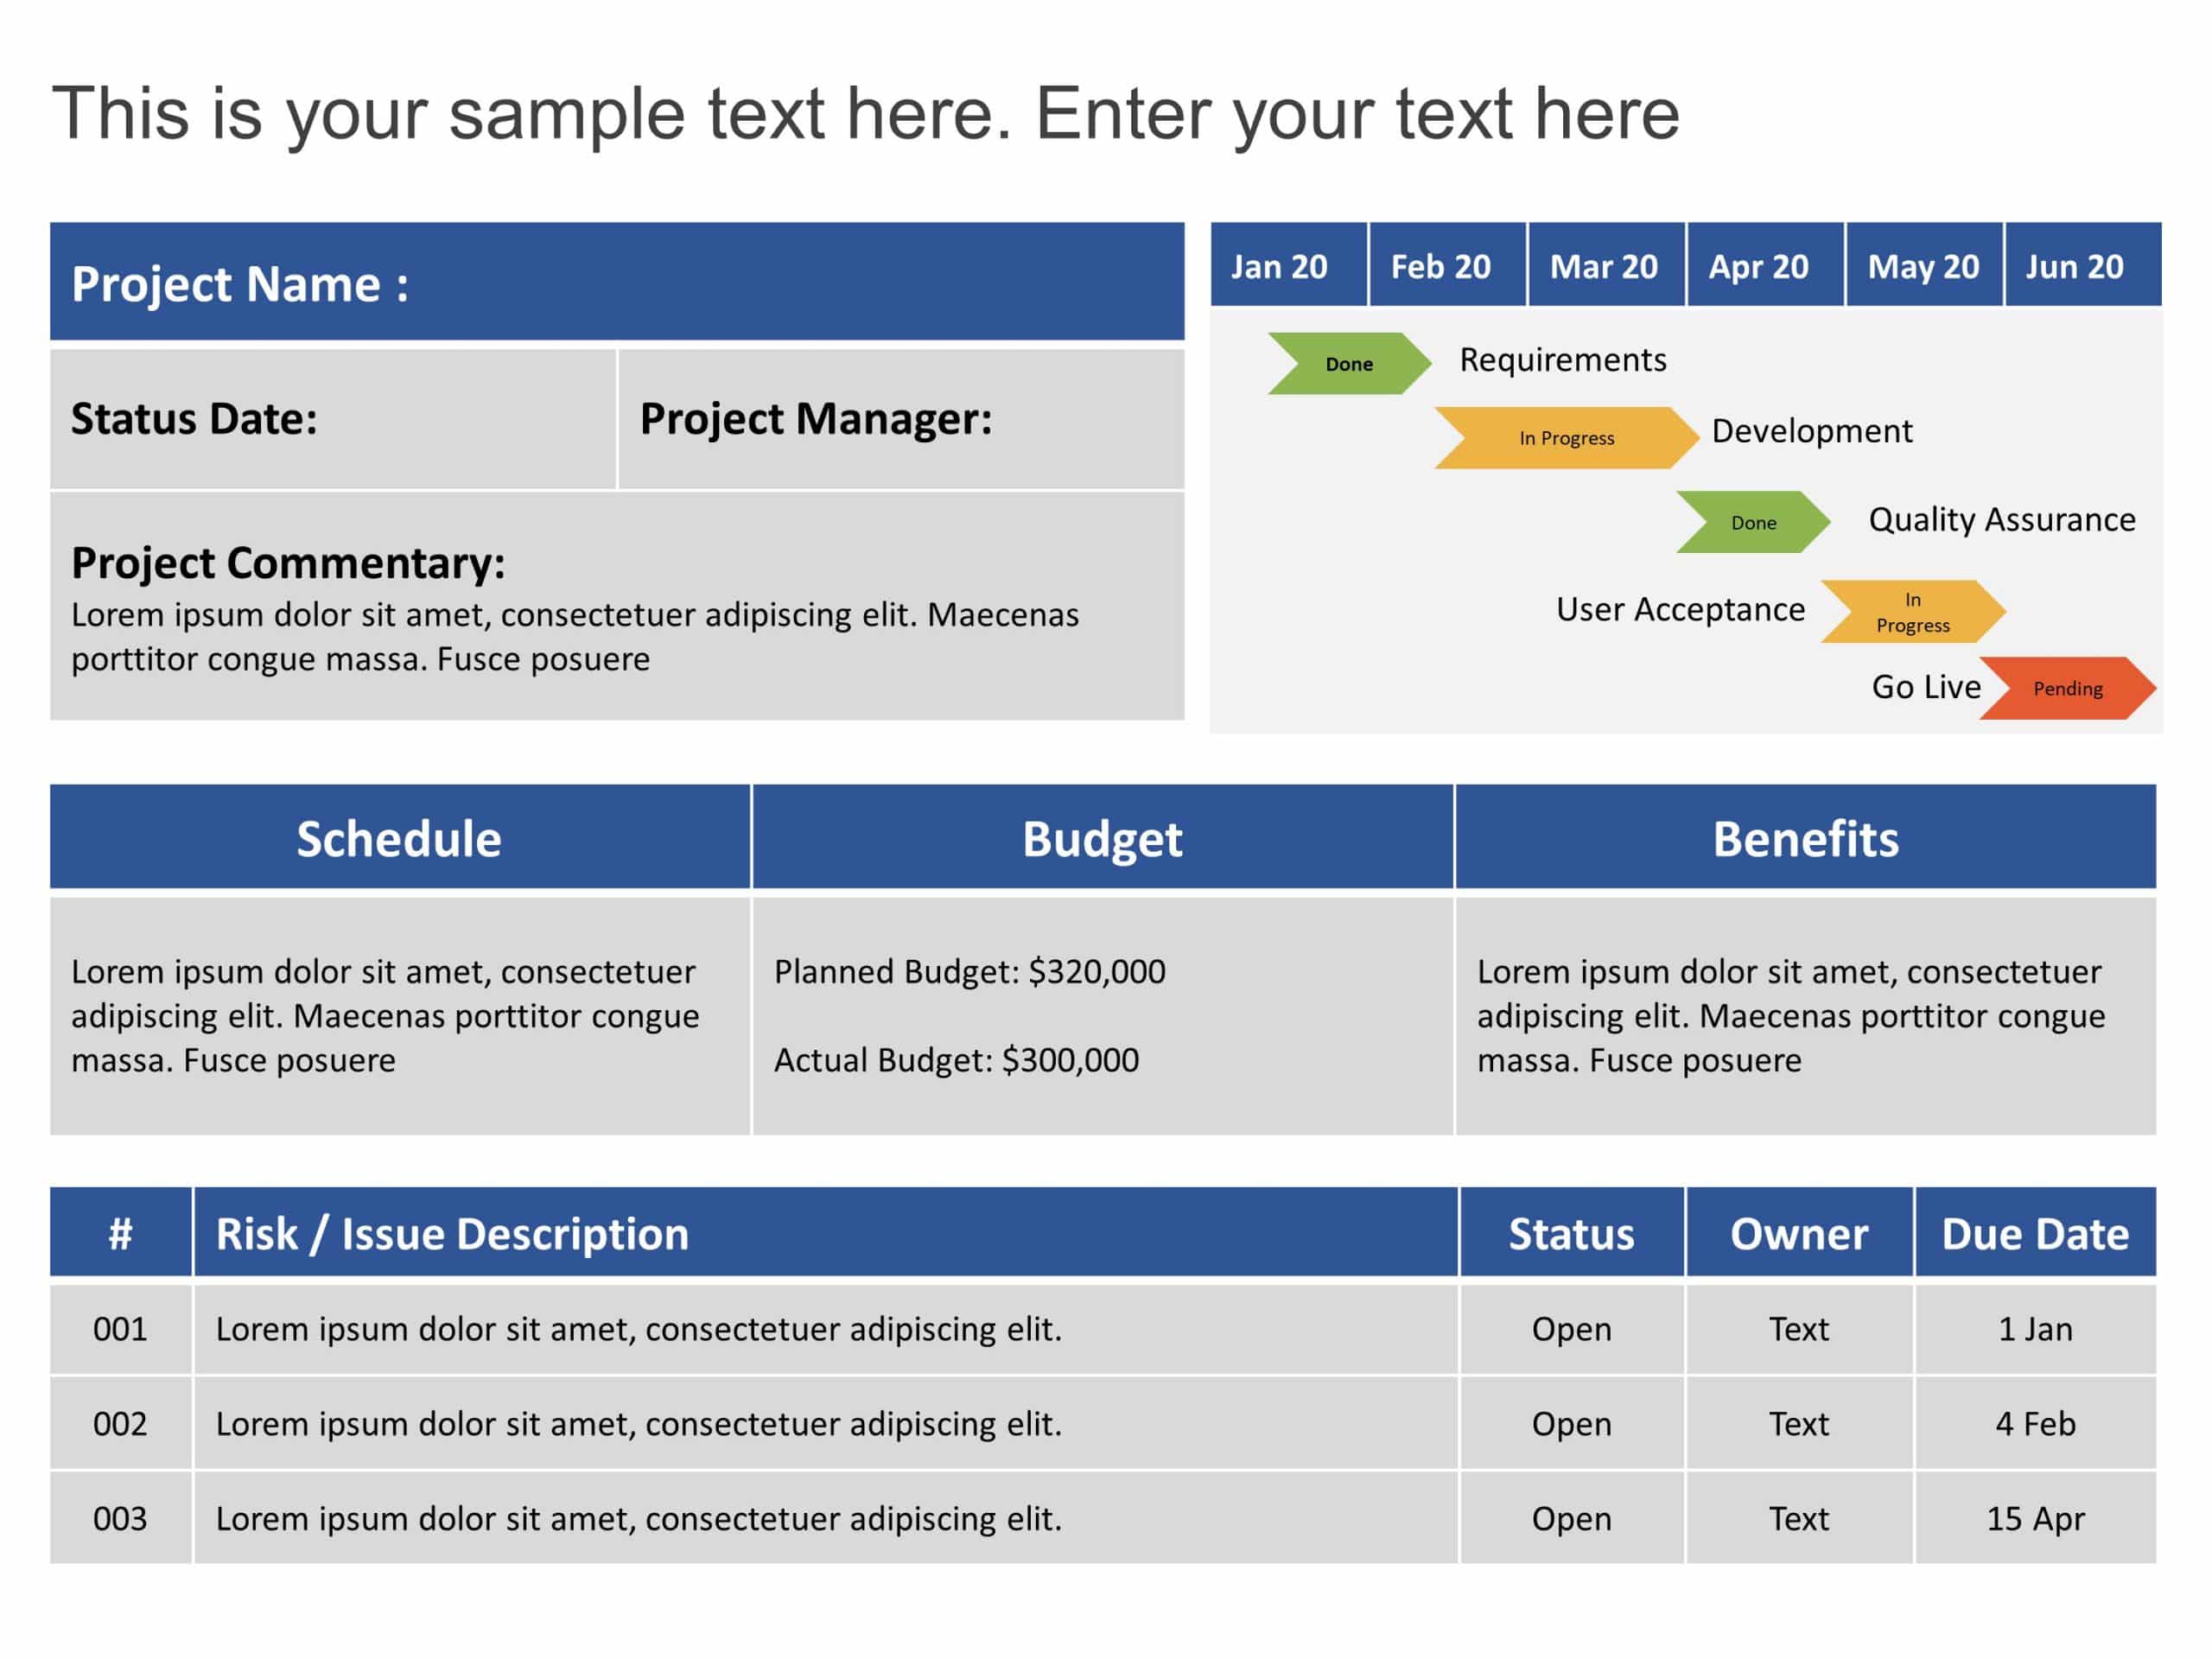
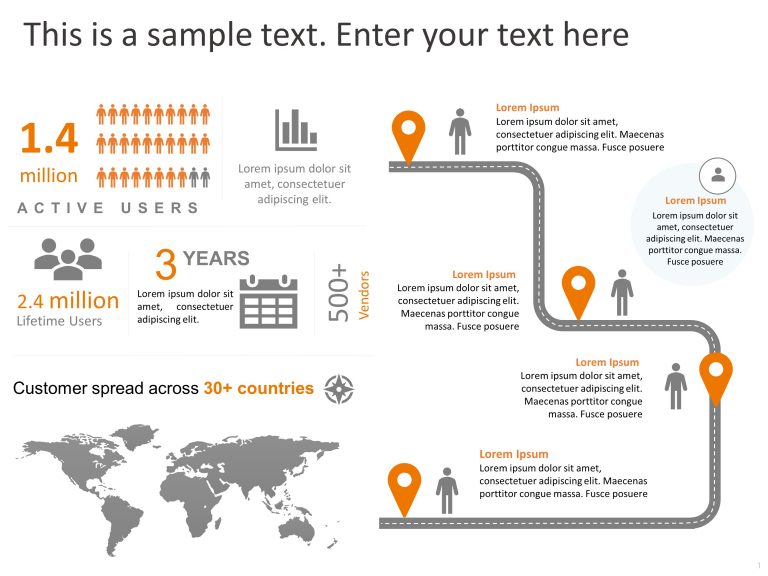
Infographics in PowerPoint are dynamic visual representations of facts and data using images, icons, and illustrations. PPT infographics templates enhance audience engagement during presentations by incorporating customizable graphics like timelines, roadmaps, flowcharts and other visuals. These infographics can be used to creatively showcase statistics and KPIs.
What are the main elements of an infographic presentation?
The main elements of an infographics presentation are:
- Accurate Data Points
- Well-Crafted Text
- Engaging Visuals
- Right Color Palette
- Easy to follow Design
What are various PPT infographics that can be used in a presentation?
Various PowerPoint infographics that can be used in presentations are process infographics, timeline infographics, comparison infographics, statistical infographics, geographic infographics, and more.
Where can I use infographics templates in PowerPoint and Google Slides presentations?
Infographics presentation templates can be used in various business presentations, including marketing and advertising, academic presentations, annual reports, business pitching, project management, and more.
How can I make the best infographics presentation?
Follow the tips below to create the best infographics presentation:
- Outline the main points you want to convey.
- Keeping the design simple is crucial.
- Use clear and concise language.
- Choose a cohesive color scheme.
Can I edit the elements in infographic templates for PowerPoint?
Yes, you can edit the elements in our premium as well as free infographic templates for PowerPoint and Google Slides. The free PowerPoint infographics templates are designed to be fully editable, allowing you to modify the text, replace icons or images, adjust colors, resize elements, and rearrange the layout to suit your content.
Related Presentation Templates
-
Morphing
6 templates
-
Silhouette
72 templates
-
Images
83 templates
-
Poster
27 templates
