PowerPoint Diagram Templates
What Is A Powerpoint Diagram Template?
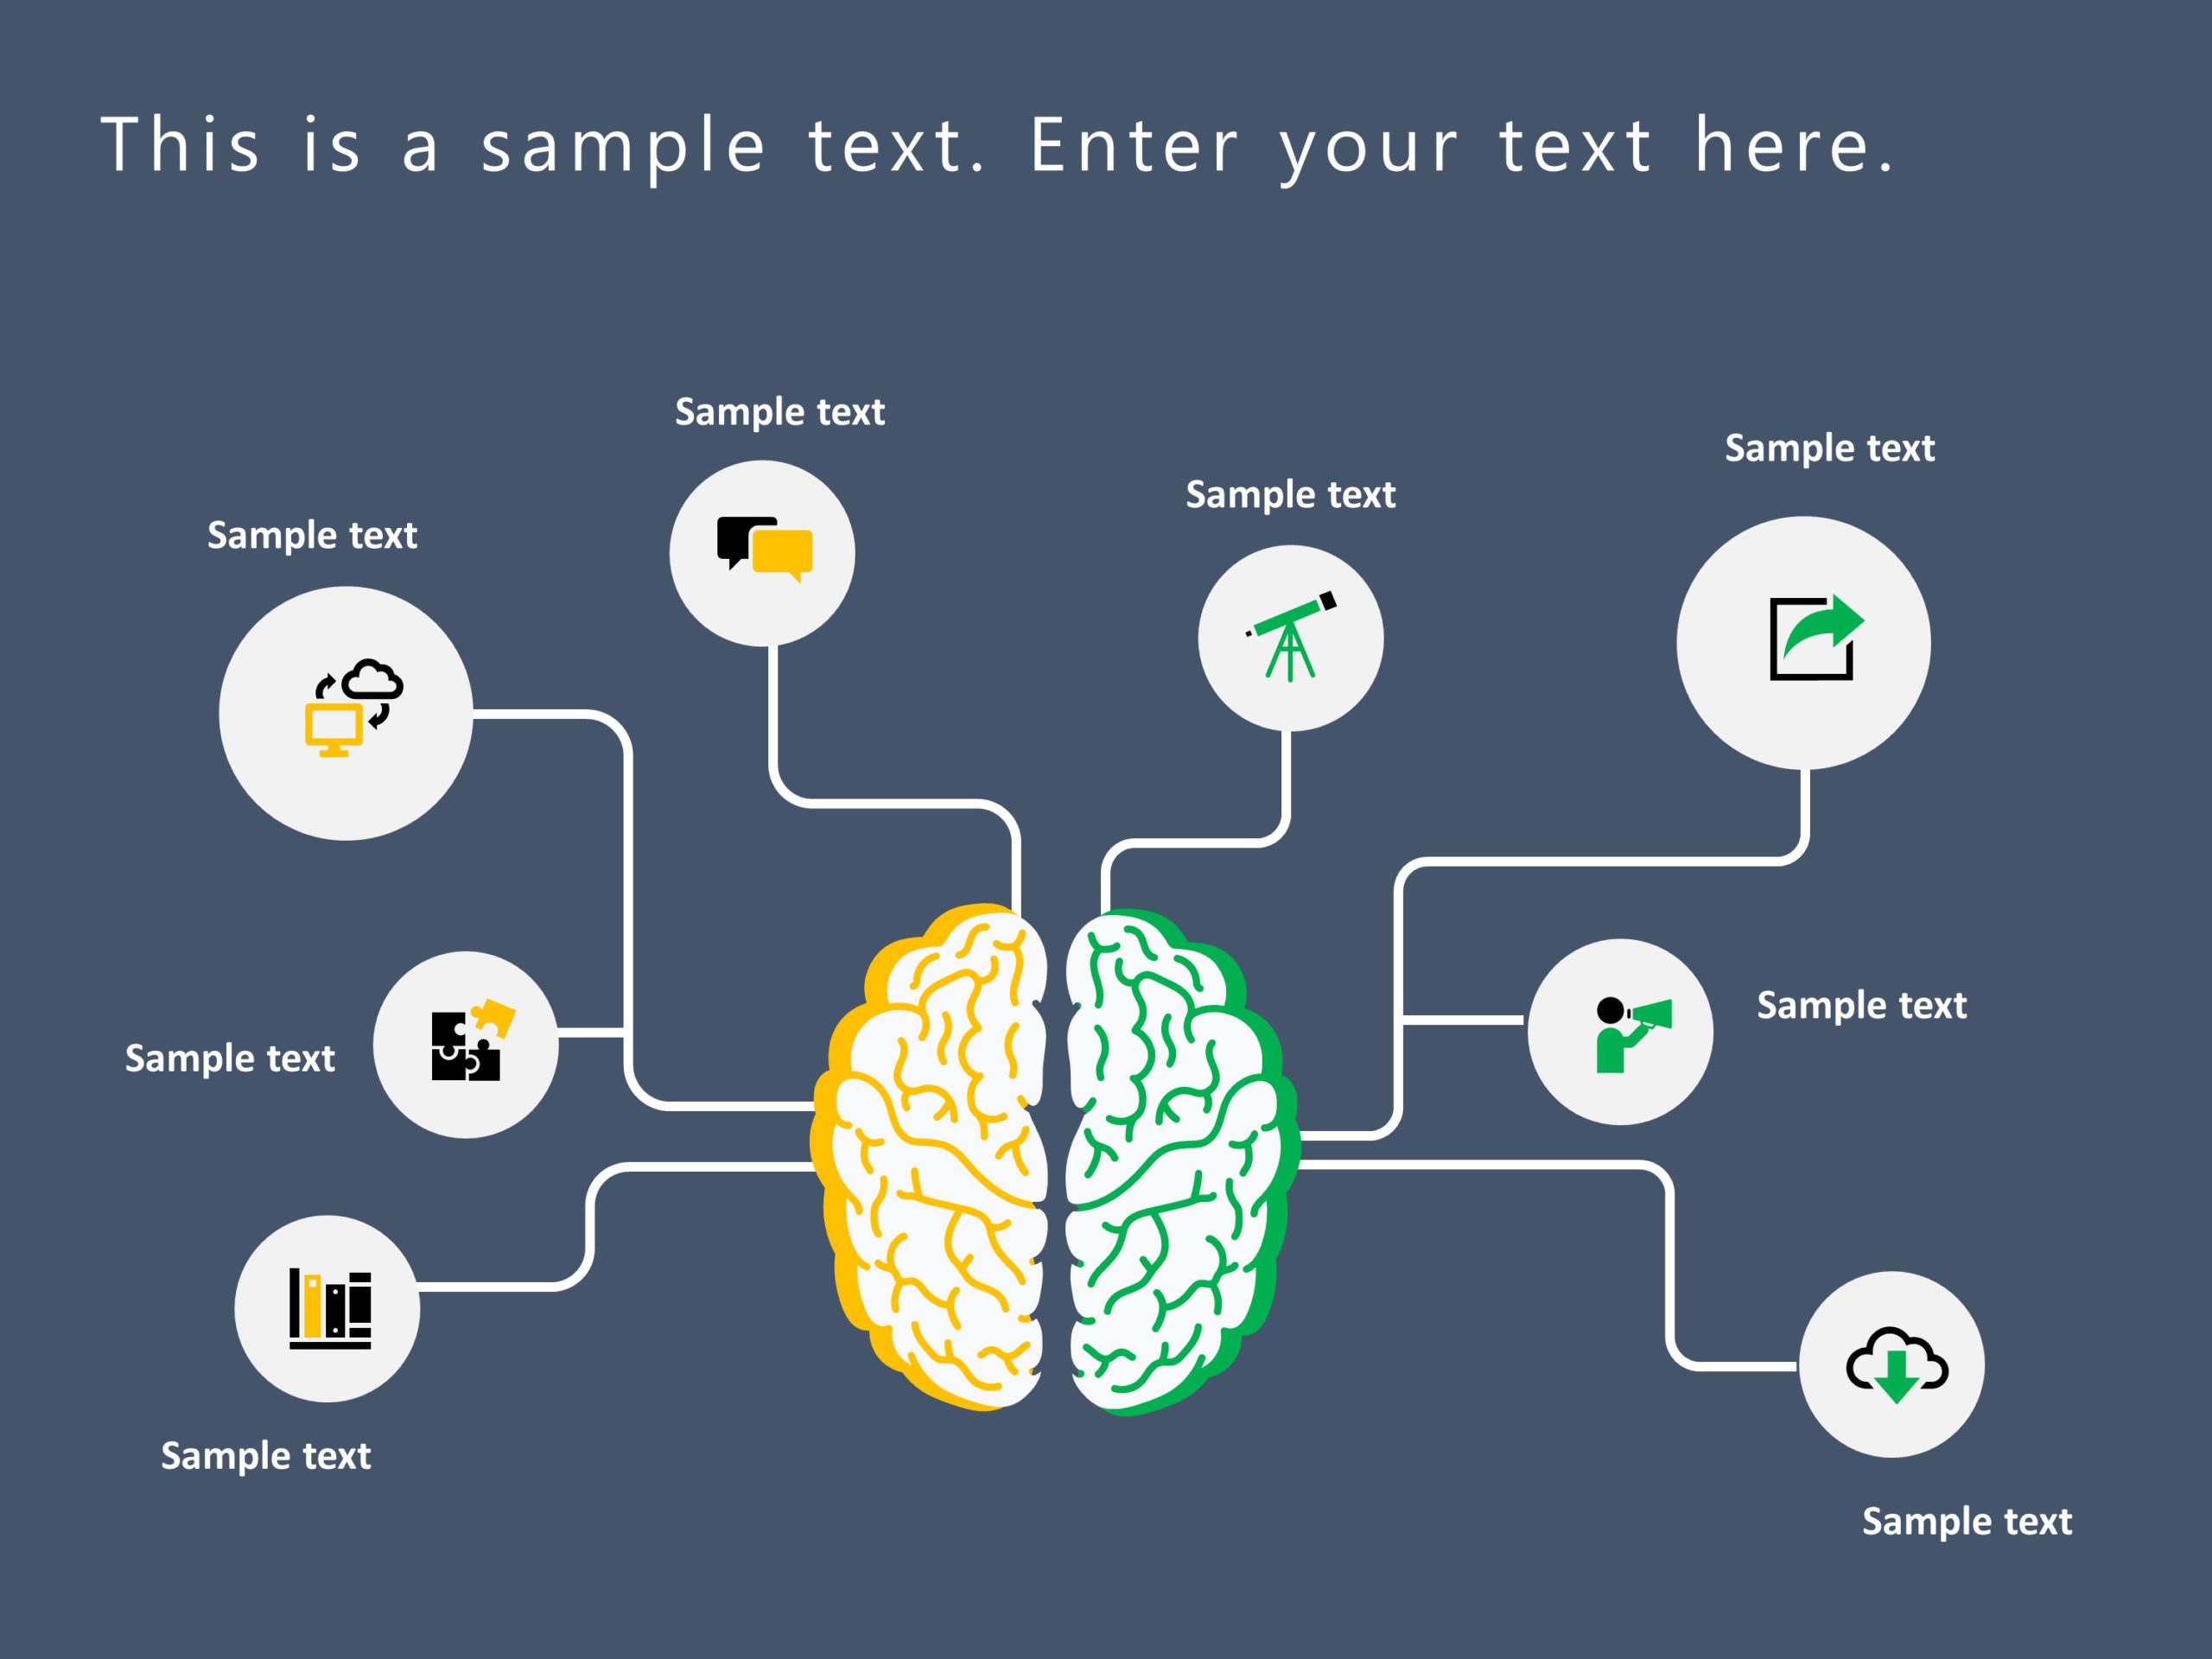
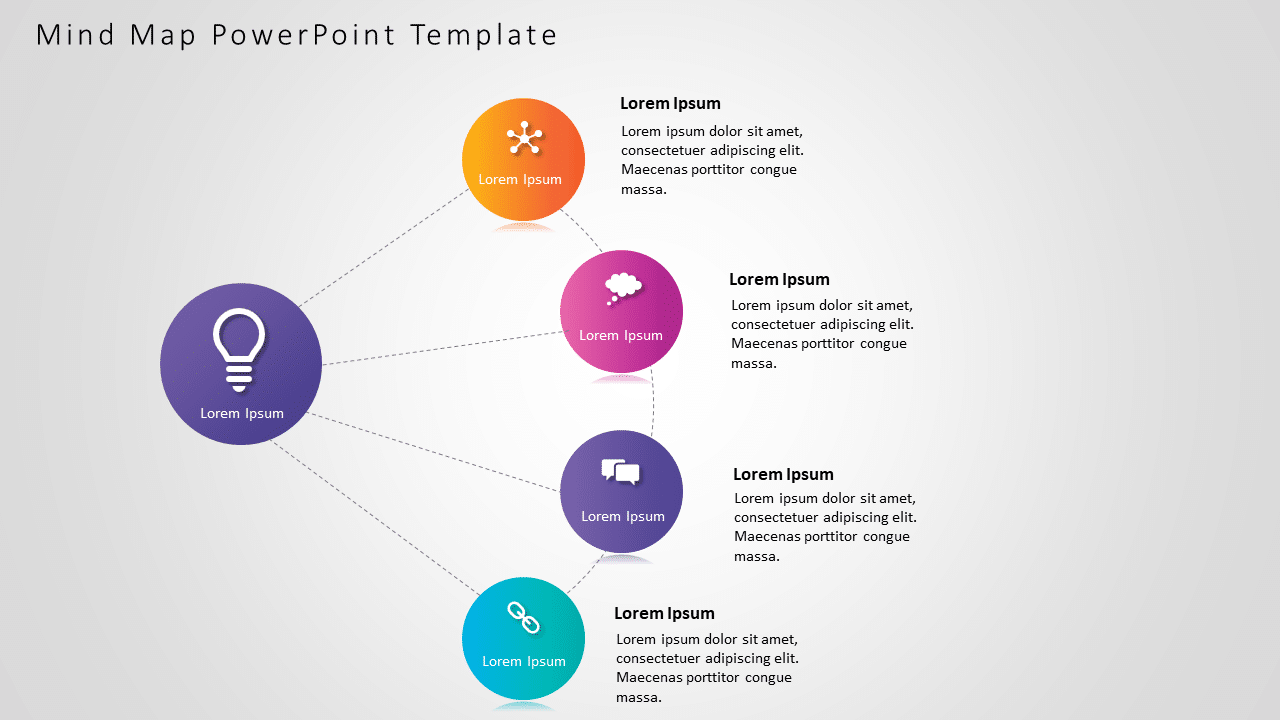
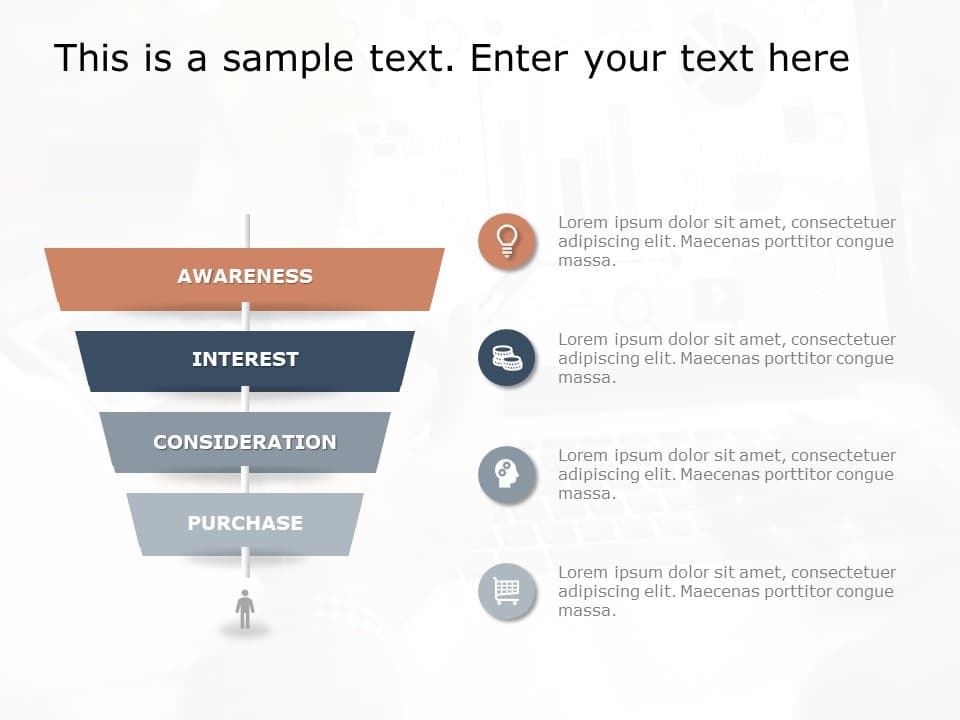
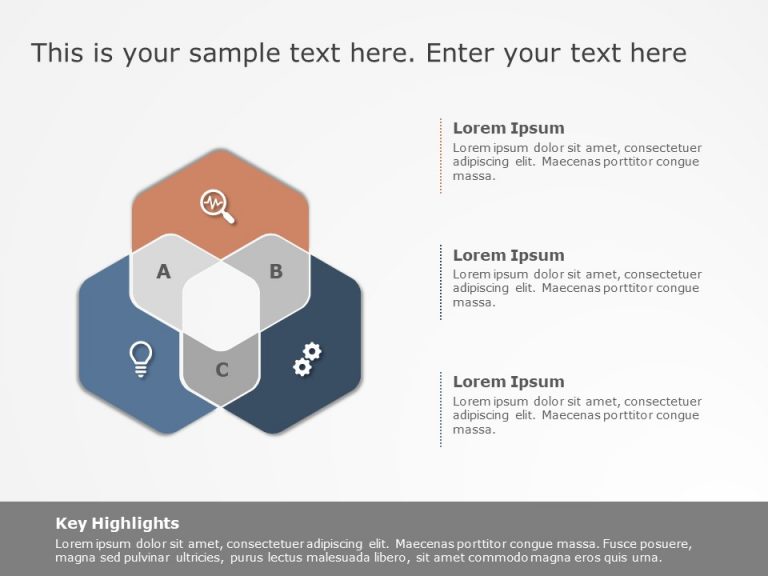
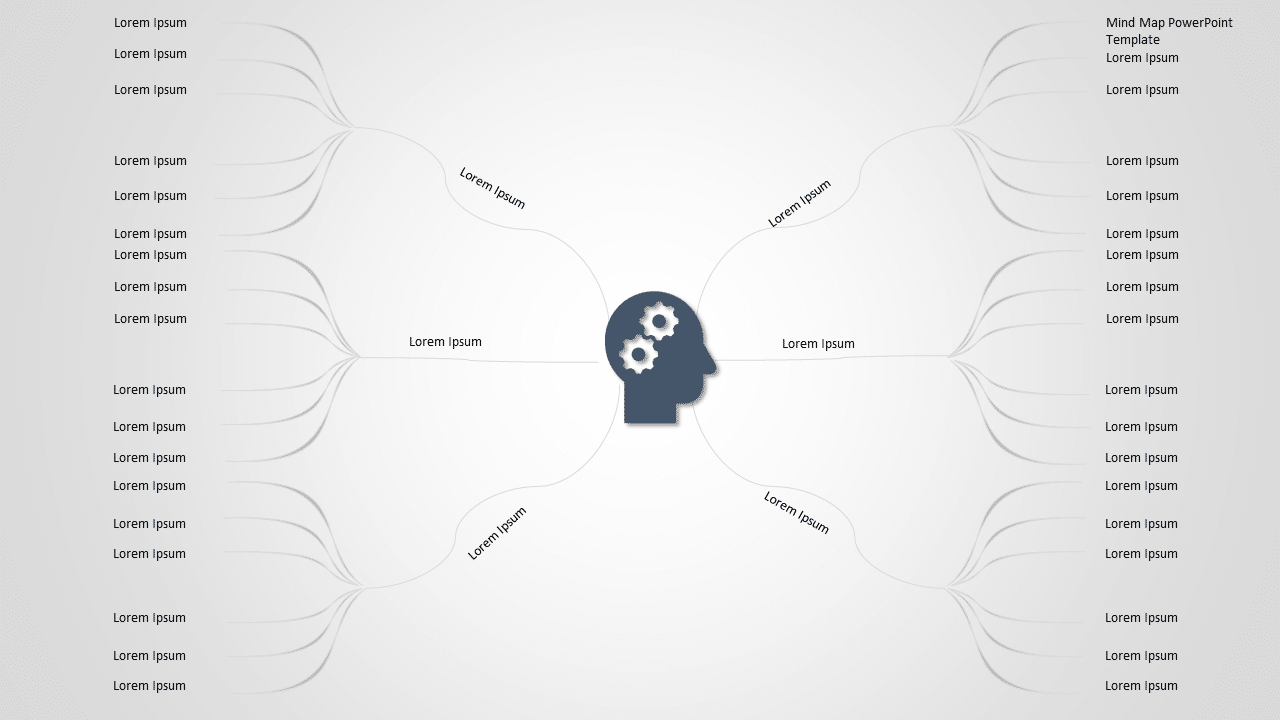
PowerPoint diagram template is pre-designed visual representations that can be easily inserted into a PowerPoint presentation to illustrate complex concepts or ideas. These templates typically feature different types of diagrams, such as flowcharts, process diagrams, organizational charts, Venn diagrams, timeline templates, and more. The purpose of using diagram presentation is to save time and effort in creating visually appealing and effective diagrams. With the templates, users can simply insert their own content into the placeholders and customize the colors, presentation fonts , and styles to match the overall look and feel of their presentation.
Why Should You Use PowerPoint Diagrams?
A diagram in powerpoint can be used to make a presentation attractive and engaging. By using diagrams in PowerPoint, users can create more engaging and memorable presentations that are more likely to resonate with their audience. Power point diagram are used to:
- Make your boring business presentation fun and appealing
- Help the audience understand your slide-through visuals
- Showcase a lot of data in a single slide, etc
- Diagrams present information in a clear and concise way
- Diagrams are an efficient way to present large amounts of data or complex processes
- Visual aids help audiences remember key information more effectively.
How Can I Add A ppt Diagram To My PowerPoint Presentation?
Diagrams in powerpoint are a visual representation of data or information that is created using shapes, lines, and other presentation graphic elements in Microsoft PowerPoint.
To add a diagram to your PowerPoint presentation, click on the “Insert” tab in the ribbon, and then select “SmartArt” or “Charts” depending on the type of diagram you want to create. You can also import a pre-made diagram from an external source.
What Types Of Diagram Templates Are Available In PowerPoint?
PowerPoint offers a variety of diagram types, including organizational charts, process flow diagrams, cycle diagrams, pyramid diagrams, and venn diagrams in google slides.
Where Can I Find Free PowerPoint Diagrams To Use In My Presentation?
PowerPoint provides built-in templates that include pre-made diagrams, and there are also many websites like SlideUpLift, presenter media, smile templates, etc that offer free or paid diagram powerpoint templates and resources.
Related Presentation Templates
-
3D
421 templates
-
Venn Diagram
72 templates
-
Isometric
65 templates
-
SmartArt
549 templates
-
Animation
473 templates
