PowerPoint Templates
You can implement the professionally designed PowerPoint slide as an introductory slide or a cover for team presentations. This cover slide is he....
Use this 3D Ramp roadmap template to visualize and communicate your project phases or any four aspects of a specific topic in a structured and cl....
Enhance your project presentations with a user roadmap template that streamlines information sharing effectively. This appealing template showcas....
This innovative dashboard is perfect, for call center experts looking to make a statement! It provides an visually appealing platform to display ....
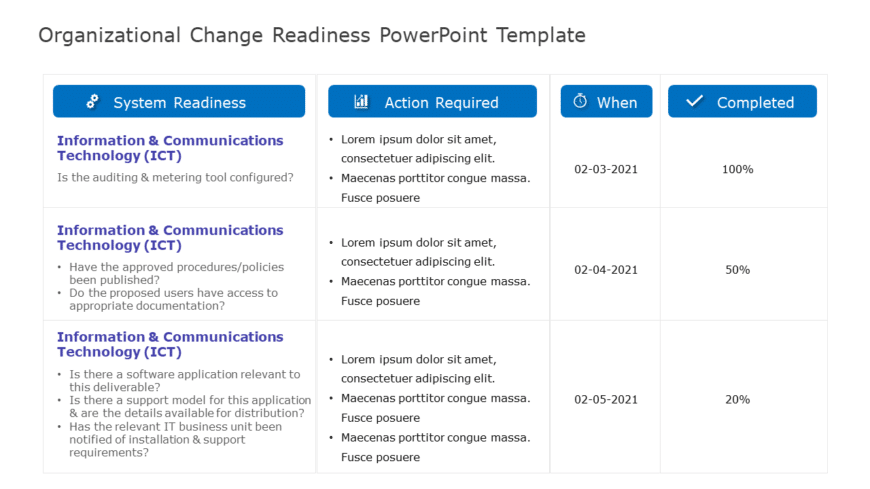
Create a story using this all encompassing outline crafted to evaluate how prepared an organization is, for change initiatives effectively. This ....
Make sharing information with this template created for presenting diversity and inclusion strategies effectively.The colorful design and puzzle ....
Share your vision using this designed template, for ERP planning purposes! The pleasing design includes an infographic highlighting key elements,....
Amaze stakeholders with this captivating Venn diagram layout crafted for OKRs presentations that focuses on showcasing the relationships, between....
Crafted to be clear and impactful; elevate your presentations using this structure customized for aligning goals. This design highlights a striki....
Explore the benefits of using this fishbone diagram template tailored for analyzing causes in presentations.. Its appealing design simplifies com....
Elevate your presentations with this risk assessment gauge template that emphasizes clarity and effectiveness! This eye catching slide showcases ....
Revitalize your data using this Venn diagram template crafted for the analysis of media trends and insights, on varied platforms such as WhatsApp....


