![]() Spring Sale
Spring Sale ![]() Flat 10% off on our Unlimited Access Yearly Membership plan!
Flat 10% off on our Unlimited Access Yearly Membership plan!

Gantt Chart PPT Templates for Presentations
Free Gantt Chart PPT Templates

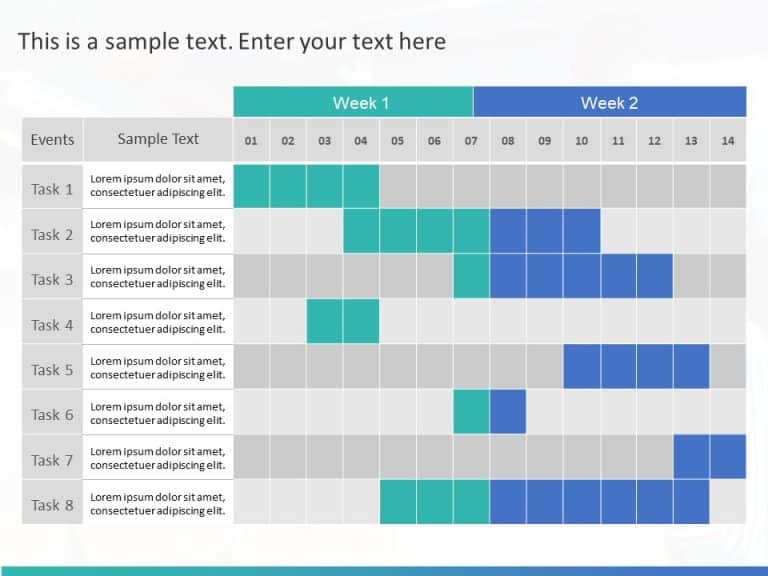
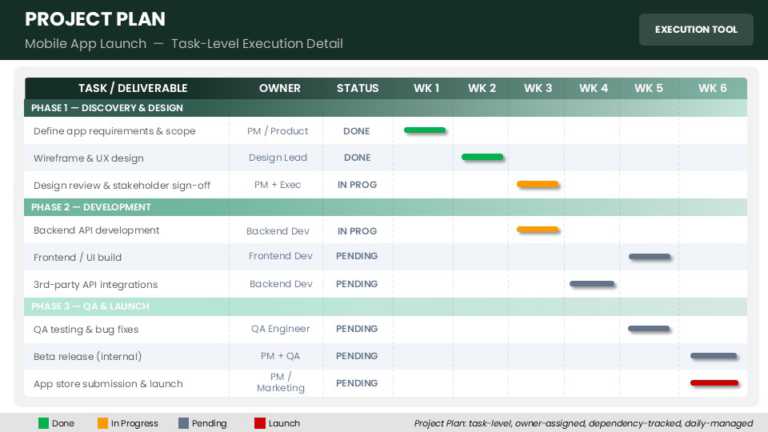
This Gantt Chart Template overviews project phases, task dependencies, and durations. It aids in planning, scheduling, executing, and monitoring project activities. The template has a color scheme of blue, green, and gray that portrays professionalism. There is space for the title at the top of this Gantt Chart PPT template. A column on the left side mentions the number of...
read more
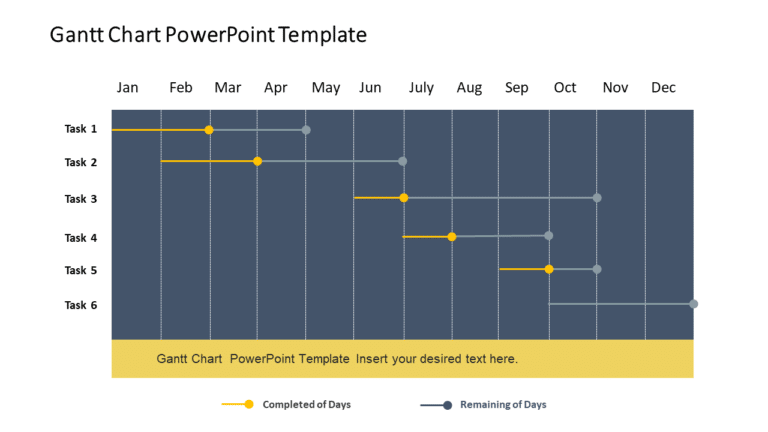
This free Gantt Chart Template has been created to display tasks clearly over time. This template helps individuals visualize the duration of a task. It also includes the start and end times of each task. It is a resource for organizing and monitoring projects. The title Free Gantt Chart PowerPoint template is present at the top. The template is presented...
read more
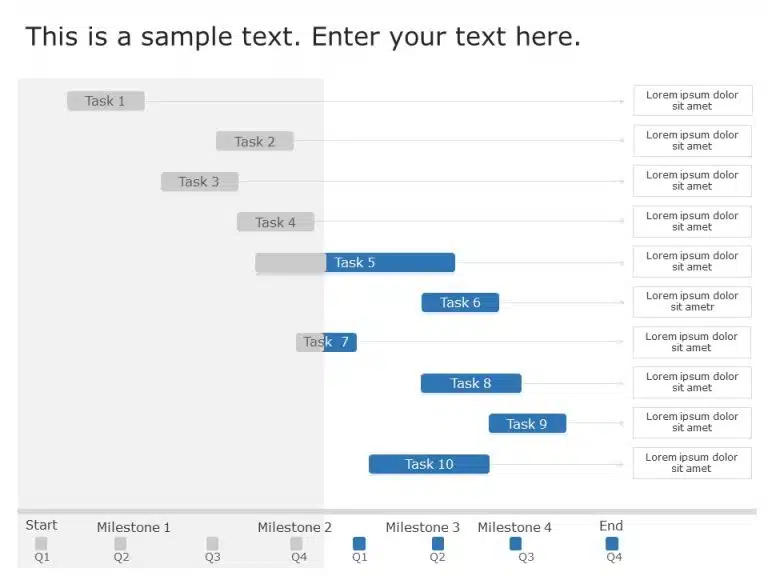
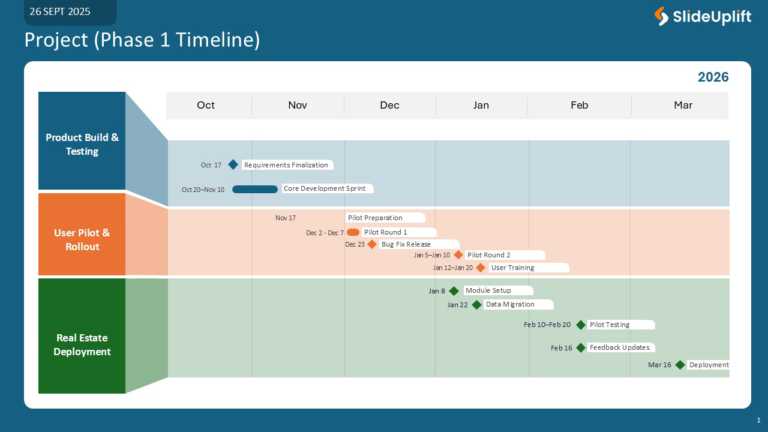
This Free Gantt Chart PowerPoint Template helps to plan and understand task dependencies. The milestones mentioned are crucial for monitoring progress. It ensures the project stays on track with key achievements at the right times. It can be used by project managers, team leaders, consultants, and event coordinators. There is a header at the top of this Free Gantt Chart...
read more
Gantt Chart Templates

Present ideas with this dynamic animated timeline template that brings your project plans to life! Perfect for project managers and team leaders,....

Present ideas with this dynamic timeline template that keeps your team aligned and informed! Designed specifically for tracking employee work sta....

The Product Roadmap Execution Plan Google Slides Template is a customizable tool for business professionals to visually organize and present prod....

This Gantt Chart Template is designed to manage and organize projects. This template has a design that helps keep track of project timelines and ....

This Gantt Chart Template presents a horizontal structure for project visualization. It offers an overview of project phrases, task durations, an....

Start by grabbing your audiences interest, from the get go using this roadmap template tailored for project coordination and oversight purposes! ....

This Animated Project Work Plan Gantt Chart Template can be used to track the progress of a project through a Gantt chart diagram. You can drag a....

Here’s a template tailored for quality assurance teams to showcase your vision effectively; it outlines your plans, for testing automation ....
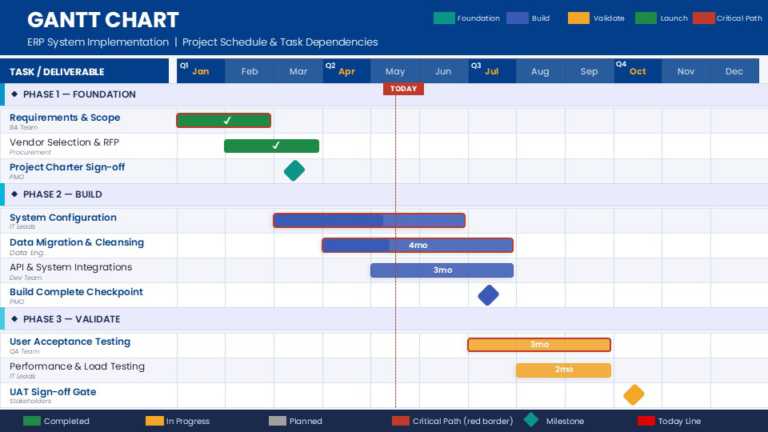
This Gantt Chart Presentation Template PowerPoint Template is designed to present ERP project schedules using a Gantt chart layout with time-base....
This Presentation Template PowerPoint Template is designed to present app development plans and project stages using a structured layout. It enab....
Give your presentations a look with this made timeline planning slide. I use the timeline planning slide when I work with project managers and te....

Effectively visualize, plan, track, and communicate your daily project schedules/tasks with our Daily Gantt Chart Templates. It helps you ensure ....
Related Presentations
-

Timeline
351 templates>
-
Roadmap
950 templates>
-
Deliverables
24 templates>
-
100 Day Planning
10 templates>
-
Progress Bar
25 templates>
What Is A Gantt Chart & Why Is It Essential?
Think of a Gantt chart as your project’s timeline for effective project planning, showing the amount of time (number of days) each task will take. Each task is a bar showing its start, duration, and end date. You and your team can track deadlines, see real-time progress, and see how tasks connect – all at a glance. No more guesswork.
Why is a Gantt Chart Essential?
- See the whole project at a glance. No more piecing together emails or spreadsheets.
- Know what comes next. Understand exactly how tasks link together.
- Stop the “Who’s doing what?” confusion. Assign work clearly. See workloads.
- Spot delays fast. Track progress against the plan. Catch bottlenecks before they derail you.
- Explain timelines easily. Show clients, bosses, or your team exactly where things stand.
- Keep everyone focused on what matters now to stay on track.
What Are The Types Of Gantt Chart Templates?
Gantt charts in PPT aren’t one-size-fits-all. Your project’s style and goals should drive your choice. At SlideUpLift, we’ve built a range of ready-to-use Gantt Chart templates for PowerPoint and Google Slides. Find your match:
- Classic Gantt Charts: Keep it simple. Plan basic schedules, track tasks, and nail deadlines, including task duration. Perfect when you just need clarity without extra bells and whistles.
- Animated Gantt Charts: Show progress as it happens. These slides use subtle motion to walk your audience through timelines step-by-step – great for keeping stakeholders hooked.
- Milestone-Focused Gantt Charts: Highlight the big wins. Spotlight key deadlines and project phases. Use these to show execs or clients what really moves the needle.
- Resource Gantt Charts: See who’s overloaded. Map tasks to people or teams to balance workloads and dodge burnout. Stop guessing who’s free.
- Agile Gantt Charts: Built for sprints, not marathons. Track iterations, deliverables, and fast-paced workflows in a clean layout. Works for stand-ups or planning sessions.
What Are The Best Practices For Creating Effective Gantt Charts?
Creating a sharp Gantt chart in PPT isn’t just slapping bars on a timeline. Do it right, and you’ll keep teams aligned and projects on track. Here’s how the pros do it:
- Define crystal-clear objectives upfront: Lock down your key goals, deliverables, and milestones before you start building. No clear targets? Your chart becomes noise.
- Break work into logical chunks: Split big projects into digestible tasks. Group related steps together – it keeps your timeline clean and shows how pieces connect.
- Stick to one timescale religiously: Pick days, weeks, or months that fit your project’s pace – and don’t waver. Switching scales mid-chart confuses everyone.
- Make milestones scream for attention: Highlight critical deadlines and phase completions visually. Your team should spot make-or-break dates at a glance.
- Use color with purpose, not decoration: Assign colors to task types, teams, or risks (e.g., red = delayed). Avoid rainbows: 3-4 colors max keeps it readable.
- Show progress like a fuel gauge: Shade task bars as work completes or add % labels. One look should reveal what’s ahead, done, or lagging.
- Treat it like a living document: Update timelines weekly (or when big shifts happen). An outdated chart loses trust fast; a current one builds accountability.
Why Use Pre-Designed Gantt Chart PPT?
Gantt charts are used for project scheduling, planning, and control. For various other applications in business, we are providing several Microsoft PowerPoint slide Gantt chart templates that can be used for presenting projects and their processes.
Here’s why they’re useful:
- Accelerate Timeline Creation: Eliminate hours of formatting work. Our professionally built frameworks deliver production-ready charts in minutes, not days.
- Project Professional Authority: Command stakeholder confidence with precision-crafted visuals. These boardroom-ready slides reinforce competence and attention to detail.
- Seamless Custom Adaptation: Modify tasks, schedules, and branding elements effortlessly using AI. Align every detail with your project’s specifications without design expertise.
- Dynamic Visual Storytelling: Animated sequences demonstrate progress chronologically. Transform complex timelines into intuitive, audience-focused narratives.
- Universal Application: Adapts flawlessly across sectors—from pharmaceutical trials to construction phases—and scales to any project scope.
- Crystalize Complex Plans: Convert intricate schedules into single-source visual blueprints. Eliminate ambiguity and ensure cohesive team understanding.
What Industries Benefit The Most From Gantt Chart PowerPoint Templates?
Gantt chart PPT templates are widely applied in various areas for project scheduling, work planning, and achievement reporting. Some of the industries that are most likely to benefit from them are:
- Project Management & Consulting: Tame multi-phase client engagements. Track interdependent deliverables, allocate resources transparently, and maintain ironclad timelines across shifting priorities.
- Construction & Engineering: Synchronize blueprints with boots on the ground. Sequence site operations, align contractor workflows, and safeguard critical path milestones—from excavation to ribbon-cutting.
- Marketing & Advertising: Master campaign chaos. Map content pipelines, media buys, and product launches on a unified timeline to prevent deadline juggling and team misalignment.
- IT & Software Development: Translate agile sprints into executive clarity. Visualize development cycles, QA phases, and release schedules at a glance—bridging the gap between scrum boards and stakeholder updates.
Every industry that relies on planning and execution requires a Gantt chart, a PowerPoint Gantt chart template, and a Gantt chart Google Slides, which are highly functional tools designed for comprehensive planning and monitoring of project progress.
How Often Should A Gantt Chart Be Updated?
A Gantt chart should be updated:
- Weekly Discipline: Refresh timelines every 7 days. This ritual prevents schedule drift and keeps your chart the team’s anchor for truth.
- Post-Milestone Recalibration: Update immediately after critical deliverables close. Lock in progress, realign dependencies, and refocus teams on the next mountain.
- Change Management Emergencies: Revise within 24 hours of scope shifts, delays, or resource disruptions. Rebaseline before ripple effects compromise deliverables.
- Agile Rhythm Integration: Sync charts after every sprint. Mirror completed backlogs and adjust roadmaps before sprint planning.
- Stakeholder Briefing Prep: Update before leadership or client reviews. Current charts prevent “whose version is this?” conversations and cement trust.
How Can A Gantt Chart PPT Template Improve Project Management?
- Reveals the full project timeline instantly: See start dates, deadlines, and overlaps at a glance—no more calendar juggling or deadline surprises.
- Tames complex work into actionable steps: Break overwhelming projects into sequenced tasks, preventing critical steps from slipping through cracks.
- Exposes progress (or roadblocks) in real time: Spot delayed tasks, advancing work, and bottlenecks immediately—so you can act, not react.
- Syncs teams through dependency mapping: Show who needs what from whom, clarifying handoffs and killing the “waiting on…” black hole.
- Turn stakeholder updates into trust-building moments: Replace spreadsheets with visual clarity—executives grasp status in 30 seconds, not 30 minutes.
What Are The Best Practices For Customizing A Gantt Chart PPT Template In PowerPoint?
- Start with Precise Project Data: Collect task names, dates, durations, dependencies, and milestones before editing.
- Apply Consistent Colors: Use a clear color scheme to distinguish tasks, teams, or phases—avoid clutter.
- Adjust Timeline Scale: Match time units (days/weeks/months) to your project’s duration.
- Highlight Milestones & Deadlines: Use bold colors/icons for key checkpoints and deliverables.
- Update Progress Bars Regularly: Display completion visually to inform stakeholders transparently.
- Prioritize Simplicity: Limit text, shorten labels, and maintain a clean, professional layout.
How Do You Present A Gantt Chart Effectively During A Meeting?
Presenting a Gantt chart during a meeting requires clarity and engagement. Here are some strategies to ensure your presentation is effective:
- Open with Context: Present the project’s purpose, scope, and overall timeline upfront to establish clarity.
- Focus on Critical Elements: Highlight key dates, progress updates, delays, and risks to direct attention.
- Apply Strategic Visuals: Color-code tasks, use bold text/icons to emphasize deadlines, owners, and critical paths.
- Display Live Progress: Integrate Project progress bars or subtle animations (where applicable) to show completed vs. pending work.
- Facilitate Team Dialogue: Invite input, clarify ownership, and use the chart to align on next steps.
How Do I Update And Maintain A Gantt Chart Template Throughout A Project?
- Review the Chart Regularly: Check for updates weekly or after major tasks are completed or delayed.
- Edit Task Status and Durations: Adjust progress bars, start/end dates, or durations as the project evolves.
- Reallocate Resources if Needed: If team availability changes, update assignments and timelines accordingly.
- Add New Tasks or Milestones: Insert new items for scope changes or emerging priorities while keeping the chart organized.
- Communicate Changes Clearly: Share updated versions with your team and stakeholders to keep everyone aligned.
- Save Version History: Keep backup copies to track project evolution and refer back when needed.
What Are The Key Components Of An Effective Gantt Chart?
- Tasks: Every project activity is defined unambiguously. (Prevents overlooked work)
- Timeline: Visualized start-to-end schedule with milestones. (Flags deadline risks early)
- Dependencies: Clear markers showing task interconnections. (Exposes bottlenecks before they stall progress.
- Milestones: Highlighted critical achievements or phase gates. (Aligns teams on non-negotiable targets)
- Progress Indicators: Real-time status markers (e.g., % complete). (Instant visibility into delays/advancements)
- Resource Allocation: Ownership assignments per task. (Optional, but clarifies accountability)
- Legend/Key: Decoding reference for symbols/colors. (Eliminates guesswork during reviews)
Are There Free Gantt Chart Templates Available For Powerpoint?
Yes! SlideUpLift delivers a free, pro-caliber Gantt chart template PowerPoint.
Download a free Gantt chart powerpoint template, a pre-built framework, and skip the blank-slide panic. These templates let you:
- Plan timelines, track progress, and present roadmaps—no design skills needed
- Adapt instantly to simple task lists or complex multi-phase projects
- Launch faster with the same sharp look as premium slides (zero cost, zero strings)
Why teams choose them:
- Professionally structured – logical layouts, clean visuals
- Custom-ready – tweak tasks/dates/colors in minutes, not hours
- Credibility built-in – walk into that meeting or client pitch, next presentation ready
- Huge Free PowerPoint templates library.
What’s The Difference Between Timeline Templates And Gantt Chart Templates?
Here’s a quick comparison between Timeline Templates and Gantt Chart Templates, tailored for PowerPoint users looking to present or manage projects visually:
| Aspect | Timeline Templates | Gantt Chart Templates |
| Purpose | Visual storytelling of key events or milestones | Detailed project planning and task tracking |
| Layout Style | Linear, horizontal, or vertical flow | Grid-based with tasks on the y-axis and time on the x-axis |
| Best Use | Show milestones, historical events, or roadmap highlights | Manage project timelines, task durations, and dependencies |
| Detail Level | High-level overview | In-depth project schedule with dates, durations, and progress |
| Animation Use | Often used with transitions for storytelling | Can include animations to show progress or dynamic updates |
| Ideal For | Presentations, marketing plans, product roadmaps | Project managers, teams, operations, and client updates |
Can A Gantt Chart PPT Template Be Used For Agile Project Management?
Yes, Gantt chart templates can be adapted for agile project management with a few modifications:
- Visualize Sprints: Use task bars to represent 1- to 2-week sprints, tracking short development cycles.
- Track Backlog Items: Group user stories by priority, assign owners, and show dependencies per sprint.
- Highlight Key Deliverables: Mark releases, sprint reviews, and milestones to improve stakeholder visibility.
- Integrate Agile Tools: Pair Gantt charts with Scrum/Kanban boards for high-level timeline context.
- Align Teams on Roadmaps: Helps non-technical teams see progress and deadlines at a glance.