![]() Spring Sale
Spring Sale ![]() Flat 10% off on our Unlimited Access Yearly Membership plan!
Flat 10% off on our Unlimited Access Yearly Membership plan!


PowerPoint Map Templates To Turn Data Into Destinations

Easily turn your data into insights using this set of editable US maps that cater to professionals, across different industries. These templates ....

Explore a range of Europe map templates that can enhance your presentations and convey your ideas effectively! This diverse collection includes m....

Start engaging your audience by showcasing this array of customizable maps of Asia! Ideal, for teachers in the classroom or boardroom professiona....

This appealing map template is perfect, for impressing stakeholders with data presentation strategies! The map showcases England in a teal color.....

Create a story using this captivating insights map tailored for presenting customer information throughout Russia effectively. This attractive de....

The Product Launch Timeline Map Template is designed to illustrate the timeline of a product launch, showing the different stages of the process ....

Use South Carolina Map 1 PowerPoint Template to make impactful presentation.

Elevate your presentations with this cutting edge template, for analyzing UAE maps at a glance!. Ideal for professionals aiming to deliver inform....

Enhance your presentations with this captivating map template tailored for displaying locations effectively and engagingly! With its contemporary....

Share your vision using this interactive map locations template tailored for highlighting areas, in Germany! Great for professionals in the busin....

Easily break down concepts using this versatile company profile template crafted for presentations! Ideal, for firms aiming to display their acti....
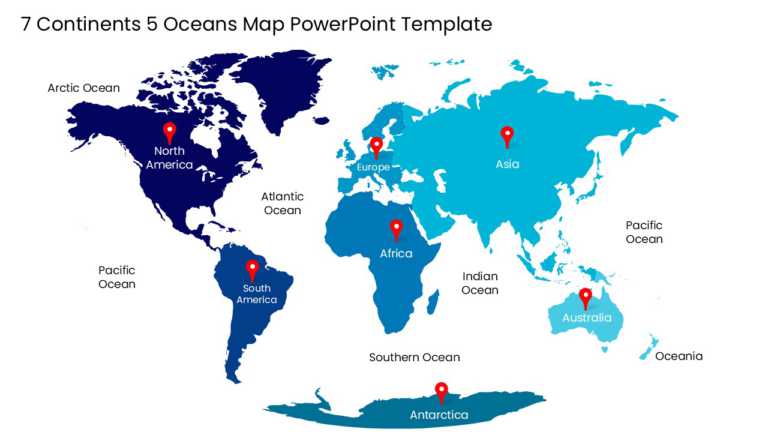
Designed for clarity and impact, enhance your presentations with this comprehensive world map template that showcases 7 continents and 5 oceans. ....
Related Presentations
-

World Maps
29 templates>
-
India Map
9 templates>
-
Country Flags
23 templates>
-
US Maps
393 templates>
-
Demographics
101 templates>
What Is a Presentation Map Template?
It is a ready-made presentation slide with a map, or an outline of a specific country, a region, a state, a territory, or a location that can be used for sharing a more visually appealing story or data. Using just the plain text and numbers can be overwhelming for the audience to grasp. But the map slide turns complex geographic information into clear and concise data, making it super easy to pinpoint ‘where’ things are happening.
What Are the Key Components of a Map Slide?
Look out for these key components in a PowerPoint map template:
- Maps of Regions or Countries (locations): Already outlined maps that display areas like countries, states, or continents.
- Editable Shapes and colors: You can easily change colors, resize areas, and highlight specific regions, as per your needs.
- Text Placeholders: These are the spaces to add names, labels, or important information directly on the map.
- Icons and Markers: Like pins, arrows, and dots to point out the locations or keypoints.
- Infographic Elements: Like charts, legends, heatmaps, or numbers to explain your demographic data visually.
What Are the Different Types of Map Presentation Templates Used for?
|
Type of Map Slide |
What It Shows |
Common Use Cases |
|
World Map Slides |
Global view of countries and regions | Market expansion, global presence, and international business reports |
|
Country or Regional |
Focus on a single country or region (like the USA, Europe, etc.) | Market analysis, regional performance, localized strategies |
|
State or Province |
Detailed areas within a country | Sales distribution, territory management, and area-specific reporting |
|
City or Location Marking |
Cities, branches, or specific points on a map | Office/facility locations, retail network, franchise footprint |
|
Heat Map Slides |
Color-coded intensity or density | Customer demographics, buying patterns, sales hotspots |
|
Route or Path |
Travel routes, delivery paths, or distribution lines | Logistics, supply chain visualization, delivery, and coverage analysis |
|
Infographic Map Slides |
Maps combined with charts, icons, or data visuals | Competitor analysis, market comparison, and research presentations |
How to Insert a Map in a PowerPoint Presentation?
Here is an easy way in which you can create a map or insert a map in PowerPoint:
- Open PowerPoint and go to the slide where you want the map.
- Click on ‘Insert’→ ‘Chart’ → ‘Maps’. You may see ‘Filled Map’ as an option.
- A sample map chart will appear on the screen along with an Excel sheet.
- Here you can enter the specific location names and the data in the sheet. (like different countries, states, or regions)
- The map will automatically update once you close the sheet with the desired changes.
- You can format and style the map using the ‘Chart Design’ or ‘Format’ tab.
What is a map slide?
It is a ready-made presentation slide that includes a map that shows locations, regions, or areas with data in a visually interesting way. This helps to turn the location-based data into eye-catching visuals. This makes it easier for the audience to understand where the story or data takes place.
How do I present a map slide during the presentation?
When you are presenting a map slide:
- Begin with the overview, meaning, show the full map first. This will let the audience know which particular region is going to be examined.
- Highlight the key areas step-by-step. Use animations or focus boxes to guide the attention of the audience.
- Explain data clearly, as in what the map shows and why it matters.
- Add zoom effects so you can talk about one location at a time without letting the audience get distracted by other points on the map.
How can I incorporate animated map effects into my PPT slides using PowerPoint map templates?
You can make your slides more dynamic by:
- Adding a zoom or fade animation effect to reveal the regions, one by one.
- Using motion paths to show routes or supply chains.
- By highlighting areas in a sequence to guide attention when you are explaining.
- Combining text or icons with animations for powerful storytelling. Like color-coding the regions to show patterns or differences.
Are there any free map PowerPoint templates I can use?
Absolutely! There are many websites that provide free map slides. SlideUpLift has a huge collection of free PowerPoint map templates that are professionally crafted with easy customizable facilities. They are compatible across platforms like Microsoft PowerPoint, Google Slides, and Keynote. There are numerous PowerPoint background templates that just need a click to download to make them yours.
How to create a map in PowerPoint?
You can create a map in PowerPoint using these easy-to-follow steps:
- Go to Insert > Chart > Maps > Filled Map. An Excel sheet will appear along with the map, where you can later add in your data and save the changes.
- Using a professionally created template from SlideUpLift. Just download these super editable PowerPoint templates and start adding your personal touch to them.
What types of data can be shown on a map in Google Slides?
A map slide can visually show many types of location-based information, like:
- Sales or revenue by region.
- Customer density or demographics.
- Market reach or business expansion plans.
- Competitor locations.
- Logistics and supply chain routes.
- Territory or area performance.
What is the difference between PowerPoint map templates and Google Slides map themes, and when should I use each?
Presentation map templates are made for flexibility and professional use. They let you edit every part of the map, change colors to highlight regions, add animations, and make polished and detailed slides.
Google Slides map themes are simpler and meant for quick collaboration. They are fine for basic presentations or team sharing. But they do not offer deep customization or animation options.
To conclude, if you need professional, completely editable map slides, use PowerPoint templates. And if you need something quick and shareable, Google Slides will do the job.