![]() Spring Sale
Spring Sale ![]() Flat 10% off on our Unlimited Access Yearly Membership plan!
Flat 10% off on our Unlimited Access Yearly Membership plan!


PowerPoint Infographic Template Designs – Present Smarter, Not Harder

This 3D PowerPoint template is a versatile and creative presentation template used for various purposes. The template helps showcase multiple asp....

Enhance your influence with this set of aids tailored to highlight strategies, for growth! This design template showcases a color palette that ex....

Enhance your presentation, with this strategic initiatives template that will captivate your audiences attention and guide them through key steps....

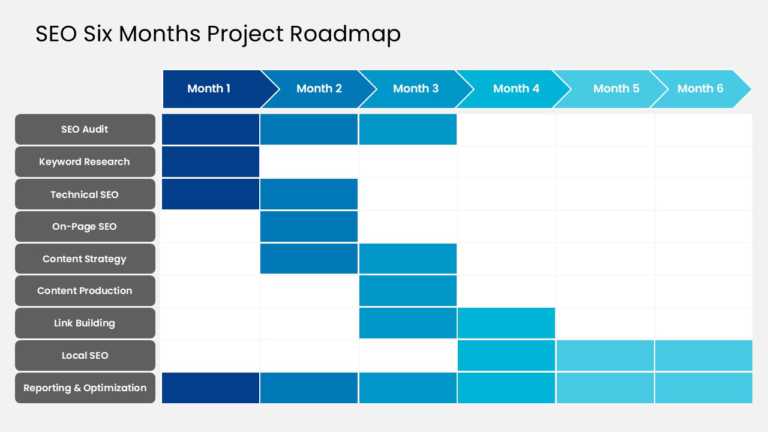
The “Editable Timeline Infographic PowerPoint Template” clearly displays a timeline. This timeline is represented by a wavy route tha....

Showcase your vision using this template crafted to highlight cutting edge solutions that stand out in a crowd of ideas and presentations alike, ....

Enhance your presentation with an captivating infographic template created to illustrate processes or steps in an appealing manner that stands ou....

Use this Charts Infographics template to create visually appealing presentations in any professional setting. Its minimalistic design and ready-t....

This creative PowerPoint infographic offers a clean and systematic design focusing on visual clarity. The template features a prominent title bar....

Enhance your presentations with this captivating template that simplifies concepts effectively! With a combination of yellow colors and a distinc....

Similar to how a lighthouse on shore guides ships to stay on course, this template can be used to highlight important points through a presentati....

Infographic Table Of Content Presentation Template Use this Infographic Table Of Content PowerPoint template to create visually appealing present....
Related Presentations
-

Morphing
7 templates>
-
Silhouette
78 templates>
-
Images
156 templates>
-
Poster
53 templates>
What are Infographics PowerPoint Templates?
You know that glazed-over look people get during presentations? Text-heavy slides do that. Infographic PowerPoint templates fix it. They transform your numbers, processes, and ideas into visuals that click instantly – think colorful flowcharts, snappy comparison charts, and timeline graphics that tell your story before you even explain it.
The magic? These are plug-and-play designs. Open an infographic slide template, pop in your content, maybe adjust a color scheme, and you’re done. Suddenly, you look like the person who brings the good presentations (without spending hours in PowerPoint purgatory). Your audience gets it faster, remembers it longer, and nobody falls asleep checking their phone.
Why Should You Use an Infographic Template PowerPoint In Your Presentations?
There are various reasons to use infographic templates PowerPoint in your presentations, from enhancing visual appeal to having an impact; here are a few reasons:
- Instant Clarity: Let’s be real – nobody wants to decode spreadsheets during a presentation. Infographics cut through the noise, turning messy data into clear visuals that actually make sense. Your audience gets the key points immediately, without the head-scratching.
- Better Engagement: Text-heavy slides are snooze-worthy. But toss in some vibrant charts and smart icons? Suddenly, you’ve got everyone’s attention. It’s like swapping a textbook for a comic book – way more fun to look at.
- Stronger Retention: Here’s a secret: people forget your bullet points by lunchtime. But that clever flowchart you showed? That sticks. Visuals create mental anchors that help your message stay.
- Storytelling Power: Raw data is confusing – a well-built infographic tells a story. It guides your audience from “Here’s the problem” to “Here’s the solution” without losing them along the way.
- Professional Look: Nothing screams “I didn’t prepare” like a slapped-together slide. A polished infographic template instantly makes you look like you know your stuff – even if you threw it together last night.
- Time-Saving: Why waste hours fighting with PowerPoint shapes? Good templates let you drag, drop, and be done. More time for coffee, less time for design headaches.
What Are The Different Types Of Infographic Presentation?
Here are some of the most common infographic types you can use to make your presentations more engaging and easy to follow:
| Infographic Type | The Problem | The Visual Solution |
| Timeline Infographics | Explaining company history can make audiences lose interest. | Turns dates into a visual story—like a highlight reel of your best moments, making your journey engaging. |
| Process Infographics | Long instruction manuals are confusing and unappealing. | Breaks down steps visually, guiding people effortlessly from start to finish without overwhelm. |
| Informational Infographics | Fact sheets are often boring and ignored. | Combines key info with visuals and icons, making content eye-catching and share-worthy. |
| Statistical Infographics | Raw numbers can be hard to understand and dull. | Transforms data into visual stories, turning trends and stats into instant wow moments. |
| Comparison Infographics | Too many options cause decision fatigue. | Places choices side-by-side for easy comparison, helping audiences make quick, informed decisions. |
| Funnel, Tree & Arrow Diagrams | Complex structures or processes can be messy and unclear. | Organizes and connects information visually, making flows, hierarchies, or pipelines crystal clear. |
You can also explore unique layouts like circular infographic template PPT designs and infographic Google Slides template variations to enhance visual storytelling.
What Are The Main Elements Of A PowerPoint Infographic Presentation To Make It Interactive And Visually Effective?
You can make your PowerPoint infographic templates both interactive and visually appealing by combining PowerPoint’s tools with strong design principles. The main elements of an infographic template PPT in a presentation are:
- Use Hyperlinks: Make your presentation infographics feel alive! Turn any chart or icon into a secret doorway – click to jump to related slides or pull up supporting documents. It’s like giving your audience the power to explore what interests them most, keeping them hooked and in control.
- Add Action Buttons: Who says presentations have to be one-way streets? Drop-in buttons that actually do stuff – launch videos, reveal hidden gems, or skip to key sections. Suddenly, your slides feel more like an app than an infographic slideshow, and your audience stays wide awake.
- Incorporate Animations: Animations should be your spotlight, not your fireworks show. Make that revenue graph rise like bread in the oven, or have key points appear like plot twists in a good story. When done right, movement keeps eyes locked on what matters most.
- Include Interactive Content: Turn spectators into players! Quick polls, live word clouds, or simple “tap to reveal” games transform your presentation from a lecture to a conversation. Watch the energy shift when your audience gets to participate, not just listen.
- Ensure Accurate Data Points: One wrong number can derail your whole presentation. Triple-check those stats – because while people might forget your brilliant point, they’ll remember that time you quoted last year’s numbers. Current data equals instant credibility.
- Craft Clear and Concise Text: Write like you’re texting the smartest person you know – short, snappy, and to the point. If it sounds like a robot wrote it, delete it. Your slides should complement your talk, not compete with it.
- Choose the Right Color Palette: Colors speak before you do. Pick hues that match your vibe – electric blues for bold ideas, earthy tones for grounded strategies. And for heaven’s sake, if it looks like a clown’s wardrobe, start over.
- Maintain a Proper Layout: Think of your slide like a well-organized desk. Everything should have its place with plenty of breathing room. When in doubt, cut one element – your audience will thank you for the clarity.
What Is The Difference Between Static And Animated Infographic Templates In PowerPoint?
|
Feature |
Static Infographic Templates |
Animated Infographic Templates |
| Movement | No motion or transitions; content remains fixed on the slide. | Includes animations, transitions, or moving elements to add visual interest. |
| Engagement Level | Good for quick, simple data display, but less visually dynamic. | More engaging and attention-grabbing, ideal for storytelling or step-by-step reveals. |
| Best Use Case | Suitable for printed materials, handouts, or straightforward presentations. | Perfect for live presentations where you want to guide the audience’s focus and create visual impact. |
Can You Suggest The Best Free Infographic Templates For Powerpoint Presentations?
SlideUpLift offers a wide range of professionally designed free infographic templates PowerPoint that make data visualization simple and impactful. From timelines to process charts, each template is fully customizable to match your content and branding. These free PowerPoint templates with infographics are fully customizable and business-ready. Download them for free and instantly elevate the quality of your presentations.
What Are Some Tips For Selecting The Most Effective Infographic Template For My PowerPoint Presentation Topic?
- Match the style to your content – Select a template format (timeline, process, comparison, etc.) that best fits your topic.
- Keep it clutter-free – Choose layouts that present information clearly without overwhelming visuals.
- Align with your brand – Use templates with colors and design elements that reflect your brand identity.
- Ensure easy customization – Pick designs where fonts, icons, and graphics can be quickly edited.
- Focus on audience impact – Select visuals that grab attention and make your message more memorable.
Are There PowerPoint Infographic Templates That Are Compatible With Google Slides Too?
Yes! SlideUpLift offers infographic templates that work seamlessly with both PowerPoint and Google Slides. Each design is fully editable, so you can customize colors, fonts, and layouts regardless of the platform. This flexibility lets you create impactful, professional presentations without worrying about format limitations.
How Do I Customize An Infographic Template In PowerPoint To Match My Brand Colors And Fonts?
- Open your chosen template and navigate to the Design tab for color and font customization options.
- Use Customize Colors to enter your brand’s exact HEX or RGB codes for consistency.
- Select Customize Fonts to apply your brand’s primary and secondary typography styles.
- Adjust icons, shapes, and charts to your brand palette for a uniform visual identity.
- Replace default images or graphics with ones that reflect your brand’s style and tone.
- Save the customized template as a Theme to easily reuse it in future presentations.
Where Can I Download High-Quality, Professional Infographic Templates For PowerPoint And Google Slides?
SlideUpLift offers a premium collection of expertly designed infographic templates for both PowerPoint and Google Slides. Each template is fully customizable, making it easy to match your brand’s style and message. From timelines to statistical charts, the designs cater to various presentation needs. Explore SlideUpLift’s library to instantly elevate your visuals and Engagement.
How Can I Convert An Infographic Template In Canva Into A PowerPoint Slide?
- Design in Canva: Open your chosen infographic template in Canva and customize it with your content, colors, and branding.
- Download as PPTX: Click on the Share button, select Download, and choose Microsoft PowerPoint (.pptx) as the file type.
- Open in PowerPoint: Once downloaded, open the file in PowerPoint to make further edits or adjustments.
- Refine Formatting: Check fonts, spacing, and alignment, as some elements may shift during conversion.
- Save Your Slide: Finalize your edits and save the file as your presentation.
Pro Tip: Read how to add infographics to Google Slides to make your designs versatile across platforms.