![]() Spring Sale
Spring Sale ![]() Flat 10% off on our Unlimited Access Yearly Membership plan!
Flat 10% off on our Unlimited Access Yearly Membership plan!


Finance PowerPoint Templates and Slides
Free Finance PowerPoint Templates


The Marketing Budget Pie Chart PowerPoint Template is a resource for visually organizing and presenting the marketing budget, aiding in analysis, decision-making, and effective communication. The template has a title bar at the top that can be edited as per the topic. It has a pie chart in the center. This chart is divided into five sections. Each section is...
read more
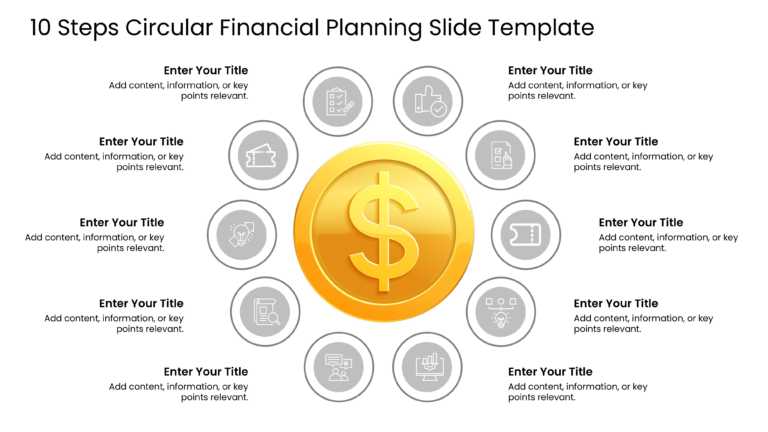
Enhance your planning with this circular layout template that makes your presentations more engaging and effective. Featuring a gold dollar sign at the core to represent prosperity and financial progress, this slide offers ten segments around it for detailing every stage of your financial strategy. The simple design and up-to-date icons help simplify the communication of details in an attractive...
read more

Use this Balanced Scorecard KPI template to create visually appealing presentations in any professional setting. Its minimalistic design and ready-to-use features enhance your presentation slides ten folds. The Balanced Scorecard KPI PPT template is professionally designed with the principles of vision sciences to capture your audience’s attention. Convey your message clearly with our unique set of editable infographics, icons, images,...
read more
Finance Presentation Templates

The Financial Summary Template is a visual-heavy and organized presentation template that can be used for budget-related aspects of a project or ....

Turn your data into insights using this financial planning template tailored for finance and business professionals like you! This slide provides....

Share your vision using this crafted finance table template that’s ideal, for displaying your budget and financial assessment results with ....

Enhance your storytelling using this forecasting tool created to bring your sales data to life effortlessly! Ideal, for professionals and sales t....

This Product Budget Pricing Proposal Template is a business proposal template that highlights the product budget and product pricing of a company....

Streamline sharing of information, with this captivating financial assumptions dashboard crafted to present your data in a manner that’s ea....

Make complex concepts easier to understand using this template created for yearly budget planning purposes.The slide showcases a graphic that div....

Enhance your presentation, with this template tailored for conducting thorough cost benefit analysis presentations! This slide offers an transpar....

Start off by grabbing the interest of your listeners using this captivating income statement template created for displays. With a design layout,....

Enhance your influence using this detailed project cost estimation template to the potential! This appealing slide is crafted to aid project mana....

Create a story using this financial data display panel tailored for corporate assessment purposes.The design is well suited for individuals seeki....
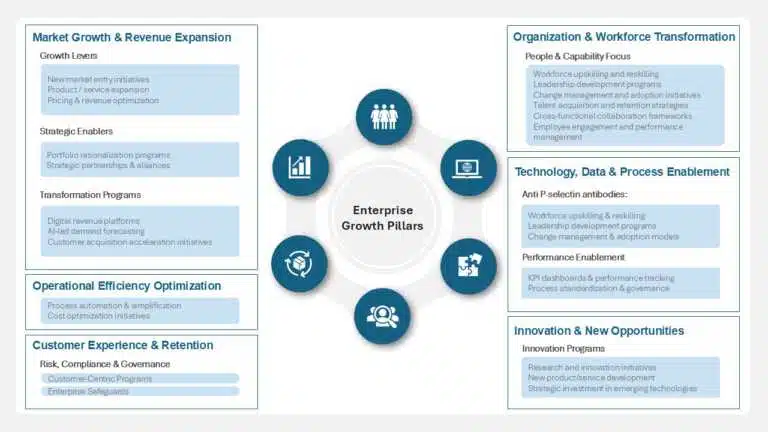
Present ideas with this dynamic framework designed to showcase the essential pillars of enterprise growth. This template is perfect for corporate....
Related Presentations
-

Finance Dashboard
35 templates>
-
Budget
65 templates>
-
Profit Loss
33 templates>
-
Cash Flow
39 templates>
-
Income Statement
40 templates>
How Finance PowerPoint Templates Save Time and Improve Communication
Pre-designed finance presentation templates are very useful for professionals. These PowerPoint templates also save time and provide a good structure that increases the chances of audience understanding and participation. In the following sections, we highlight the prior advantages backed by research and expert insights: The use of templates also reduces the time it takes in the preparation of the presentation.
Templates Save Time in Presentation Preparation
Preparing structured templates can be time-consuming, but they help with formatting so that the professionals can focus on the information to be presented. According to the Empowersuit study, employees spend about 40% of their time making presentations – about 8 hours a month – on formatting alone. This means that presenters do not have to spend time on such details as font, color, and even arranging some elements of the presentation. This is especially useful in generating time for reports and presentations.
Structured Slides Boost Comprehension and Engagement:
Finance PPT templates offer well-structured slide layouts with features like clear headings, bullet points, charts and specified placeholders, which make information easier to comprehend. Research shows that a properly structured and visually organized slide design enhances the audience’s comprehension and retention of the information given by a large margin. For instance, a peer-reviewed Assertion Evidence study established that audiences were able to comprehend and retain information better when the slides had brief headline messages and relevant visuals than the traditional bullet-pointed slides.
The use of a template with structured slides makes it easier for your audience to understand the financial data that you are presenting to them. This way of presenting the information ensures that your audience remains interested and pays attention to what you are saying. Visuals and formatting should be clear and consistent when designing the presentation to lead the viewer through the story and avoid confusion. The ability to highlight your main points with a well-structured template enhances the ability of your audience to comprehend and pay attention to the narrative.
Enhancing Financial Storytelling with Visual Templates:
Financial data is said to be powerful when it is told in the form of a story. Financial narratives have certain templates that ensure that the story is organized into various parts, such as the overview, the metrics, the story, the trends, and the ending. They also include pictures that help to explain the plot of the story behind the numbers. The templates we provide include basic bar charts for tracking revenues, pie charts for breaking down costs, and trend lines with different colors to distinguish between different time periods. It has been established that people can retain information up to 22 times more when it is presented in a story form than when it is given in the form of facts.
It is possible for a finance expert to consolidate the numbers and present them in the form of a story with the help of a template that has visuals and a specific format. This way, your audience will be able to pay attention to the information you deliver and understand the figures you provide. A good finance template is a way to present your data in a simple and clear manner. It makes it easy for decision makers to be able to pay attention and follow along with the presentation.
Finance presentation templates are important for professionals to use, they help save time, ensure continuity and improve communication. They design the layouts for you so that you can concentrate on the actual financial information that you want to present. Using the structured templates in your presentations will allow you to convey complex financial information in an easy-to-grasp and interesting manner. This way is more effective and leads to the proper identification of the audience and the formation of better financial stories.
Using these templates, individuals can produce professional-looking presentations within a short time. They can have a better belief that their message will be grasped by the public.
Types of Financial Presentations You Can Create
Financial templates in PowerPoint are versatile and can be used for almost any form of financial storytelling. Here are some typical forms of financial presentations that business professionals can easily produce with these templates:
- Financial Analysis Reports: When you have to go through the numbers in detail (say, an internal quarterly analysis or a client report), a financial analysis PowerPoint template specifically for this purpose comes with blank slides for various metrics, trends, and charts. Rather than being left with blank slides, you will have slides that are ready to use for income statements, balance sheets, cash flow analysis, and key ratios. This is especially useful to prevent the omission of some important points. Using a good template as a base, presenting a detailed analysis is much easier – you just enter your numbers and ideas.
- Investor Pitch Decks: Small business owners and entrepreneurs can make a good impression on their stakeholders by using a well-designed financial presentation template for investor updates or funding requests. There are templates for market opportunities, revenue projections, profit margins, and growth rates. In this case, you remain consistent, starting with the executive summary, using clear infographics to present financial highlights, and ending with the section on funding requirements or ROI expectations. The professional design creates a good impression and demonstrates that you are professional in your business (and, therefore, your investors’ time).
- Budget & Forecast Presentations: Project managers and the finance department are required to present budgets, forecasts, or expense reports. A finance slide template can convert a vast amount of data in an Excel spreadsheet into an easy-to-grasp graphical representation of the story. For example, you can use charts to show the comparison between the projected and actual spending or the breakdown of costs by department. Budget templates contain simple features such as the pie chart for the expenses and the line graph for the revenue to forecast. This ensures that your audience can easily understand the financial position you are in before making your budget or project updates. It’s a helpful way to convey financial plans or project updates without running everyone through a mountain of data.
- Performance and Financial Results: Marketing and sales teams often provide updates on monthly or quarterly performance – including sales revenue, marketing spend, return on investment (ROI), and profit. Using a finance presentation template for such business reviews guarantees that you have provision for all the essentials (KPIs, trend lines, quarter-on-quarter comparisons) in a single package. The visual dashboards, bar graphs, and summary tables in the template enable you to identify the positives and suggest improvements on them. This makes it easy for other departments or top management to understand the numbers and the story behind them. Even if they are not strong in finance, the structured slides assist them in going through the results section by section.
How Finance PowerPoint Templates Help Communicate Complex Data
Financial data can become very complex – it can be a long list of numbers in a spreadsheet, different ratios or several years of financial statements. However, presenting this amount of information in a presentation does not involve just putting the numbers on a slide. Here is how using professional PowerPoint templates assists in simplifying the process of presenting a complex amount of data:
- Visualizing Data for Clarity: The human brain is more adept at recognizing images than reading text. Therefore, it is advisable to present numbers in charts and graphs. A quality finance template will have many pre-designed charts, graphs, and infographic elements. Instead of listing the figures in a bullet list, you may present them in a bar chart or a pie chart that shows the comparison. For instance, presenting a table of quarterly earnings in the form of a line graph brings out the trend easily. Research supports this; graphs or charts are a more efficient way of presenting information in a summarized form, which makes it easier for people to understand your conclusions. When using a financial analysis PPT template, you will find that there are separate slides for things like key findings or by the numbers that highlight key data in a bold and visual way (for example, a large number with its label or an icon attached to it). These design elements help to draw the audience’s attention to the most important aspects so that they do not get lost in the details.
- Structured Storytelling: Finance templates are usually presented in a step-by-step format. This structure assists the audience to process the information in a step-by-step manner. You might begin with an overview or executive summary slide, then move into sections like “Revenue Breakdown,” “Expense Analysis,” “Future Projections” and so on. Each section slide in the template is a navigator that points to a new topic and prevents information overload. This way, no matter how much information you provide, the audience will be able to follow the story. It’s like chapters in a book – the template’s well-established structure makes it easier to understand what can be quite a lot of information.
- Consistent Design for Focus: This means that all the slides have the same design elements – fonts, colors, background and style – and the viewer can concentrate on the information and not on the design. A badly designed or cluttered deck may divert the attention of the viewers; they will have to pay attention to the new layouts or try to make sense of the visual mess. Finance templates solve that problem by rendering a single look of the slide throughout the presentation. To the presenter, this means you can present different kinds of data – from detailed financial tables to high-level infographics – and it will all be part of the same story. Consistency also creates trust, if the design of the presentation is consistent then it means that you have paid attention to detail. It packages the message in a way that helps support the idea that the data is sound and the presentation is well thought out.
- Highlighting Key Takeaways: Last but not least, templates assist in making sure that you do not forget to highlight the findings from the analysis. There are summary slides or callout boxes for conclusions and recommendations in many financial PowerPoint templates. These features help you to summarize the data in plain English (“Costs are down 10% YoY, which is indicative of better performance,” for instance). By the time your audience is done watching the presentation, they are not just seeing numbers; they know why those numbers are important. Since the main goal of any financial presentation is to have the audience make decisions or take action, having those clear takeaway sections is priceless. In a way, the template guides you on how to state the conclusion of the analysis in the most visual and effective manner.
In conclusion, finance PowerPoint templates (and their Google Slides counterparts) are a godsend for anyone who has to present financial information to an audience. They combine the professionalism of the design with the practicality of the structure that enables you to present the data. Using a template, you are using the knowledge of graphic designers and the experience of finance specialists who have developed these slides for presentation purposes. You will save time, avoid many mistakes that can be made in presentations and provide useful information in a fascinating way. Therefore, when preparing a financial presentation next time, it is recommended to use a template that is relevant to the type of analysis you are going to present rather than starting from a blank slide. This gives you an edge in your analysis, and you can focus on the nitty-gritty. The numbers are important, but the story behind the numbers is important. With the help of the right template, it will be easy to explain the financial data to your audience in a way that they will be able to understand and appreciate.
Are these templates optimized for specific financial presentation scenarios, such as investor pitches or internal financial reviews?
Yes, our finance PowerPoint templates are perfect for all sorts of money talks—like wowing investors with a pitch, chatting numbers with your crew, wrapping up annual reports, or figuring out next year’s budget. Every finance PPT template has slides that make your financial story super clear and easy to follow, no matter who’s listening.
What design elements are incorporated to ensure that financial data is presented clearly and professionally without overwhelming the audience?
Each finance PowerPoint template keeps it sleek and professional with:
- Chill, no-mess layouts
- Colors that pop to show what’s what
- Fun infographics and dashboards to bring the data to life
- Readable fonts and bold shades that look sharp but don’t overdo it.
Do you offer templates tailored to specific industries, like SaaS, e-commerce, or real estate, with relevant financial metrics?
Absolutely! We’ve got finance PowerPoint templates made just for fields like SaaS, e-commerce, real estate, healthcare—you name it. Each finance PPT template comes with the exact metrics that matter to that industry, so your presentation feels personal and packs a punch.
Do the templates include guidance on simplifying complex financial data for audiences without a financial background?
For sure! Our finance PowerPoint templates are loaded with simple tricks—like friendly charts, cool infographics, and little step-by-step breakdowns—to take those big, confusing numbers and make them feel approachable. They’re designed so even your non-finance friends can get the gist without breaking a sweat.
Do the templates support integration with real-time data sources or financial software for automated updates?
You got it! Our finance PPT templates can hook up with stuff like Excel, Google Sheets, or your favorite financial software to grab live data. It’s like magic—your numbers update on their own, staying spot-on without you lifting a finger.