Product Description:
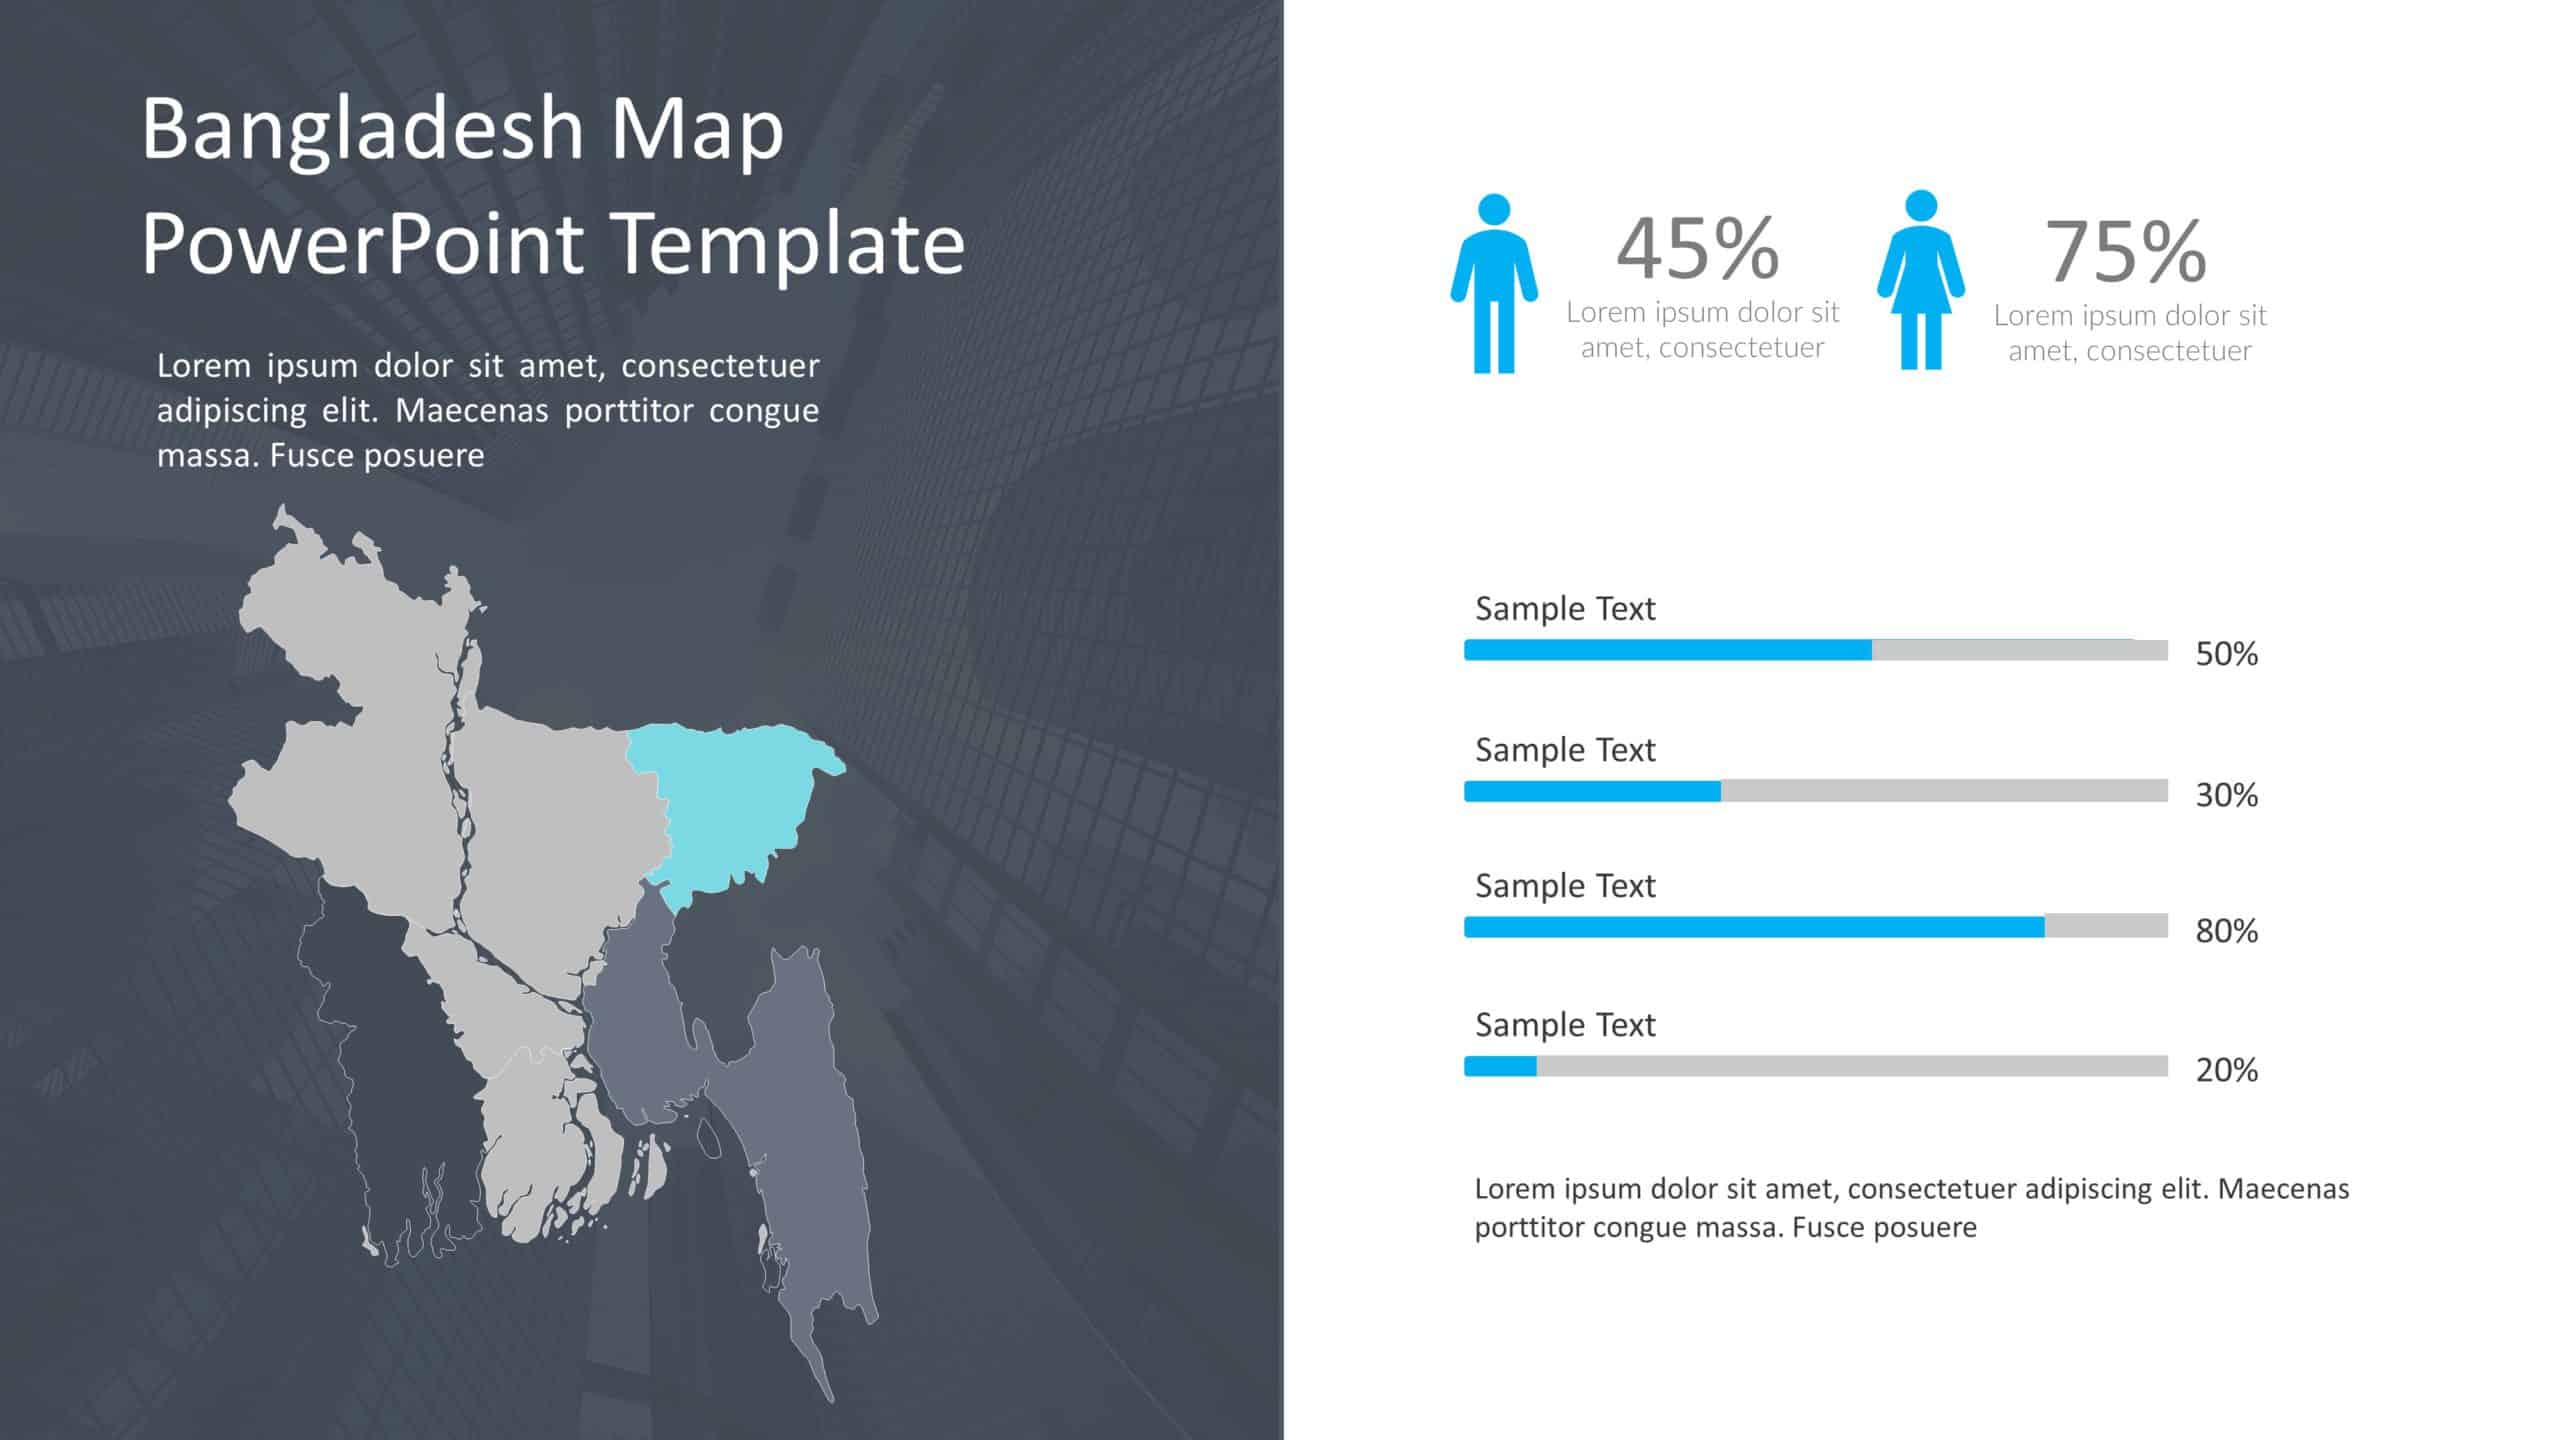
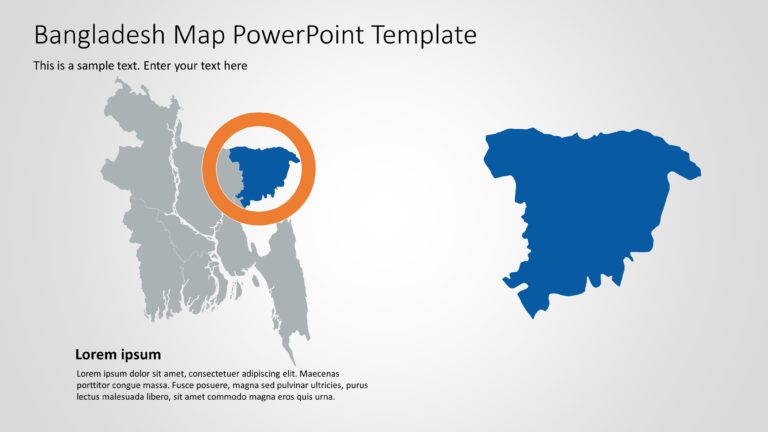
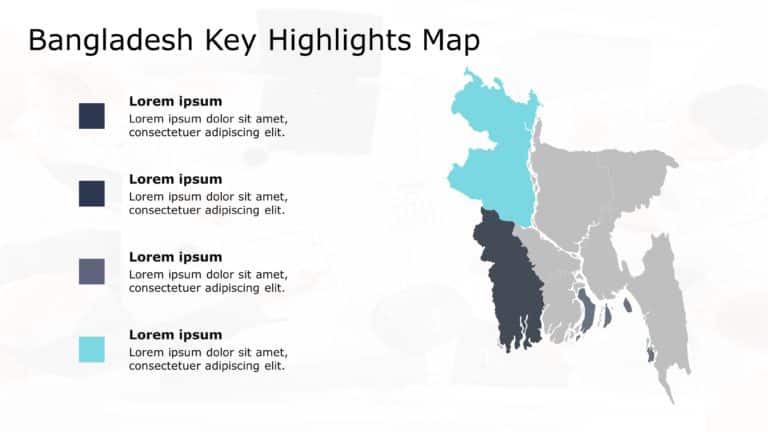
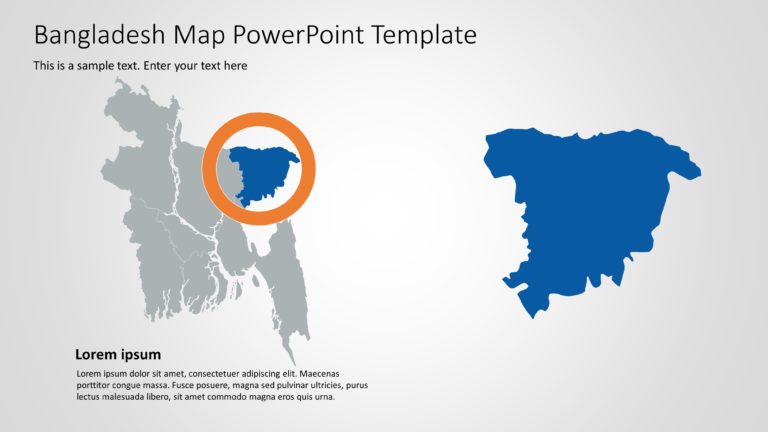
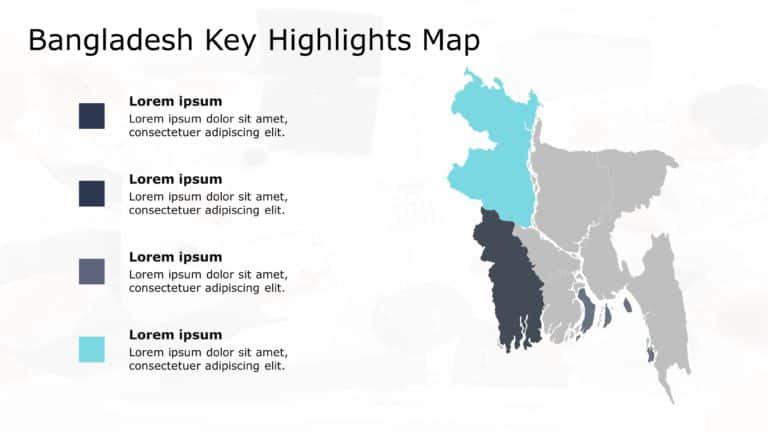
Impress stakeholders with this visually engaging map infographic that highlights key gender statistics in Bangladesh. This template is perfect for professionals looking to present demographic data in a clear and impactful way. Featuring a sleek design with a modern blue color scheme, the map allows you to pinpoint specific regions while showcasing important statistics alongside.
Ideal for educators, researchers, and business analysts, this template simplifies complex data, making it accessible and understandable for your audience. The accompanying bar graphs provide a straightforward way to compare gender-related metrics, ensuring your insights are communicated effectively.
Whether you’re preparing for a business meeting, a research presentation, or an educational seminar, this template will enhance your storytelling and keep your audience engaged.
Download now and transform your data into compelling visuals that drive your message home! Find more such Map PowerPoint templates for engaging presentations. These templates are compatible with both PowerPoint and Google Slides.


