Product Description:
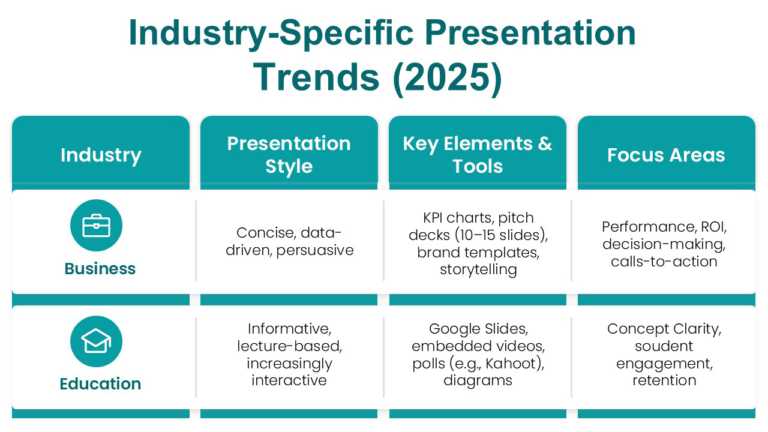
Enhance your presentation flow using this template tailored to display statistics and trends for the year 2025. Ideal for business professionals and educators, this template boasts a contemporary design that effectively emphasizes crucial data points with precision and elegance.
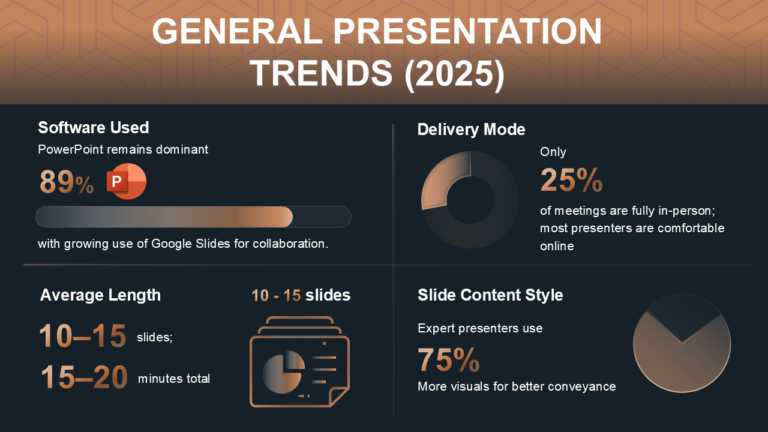
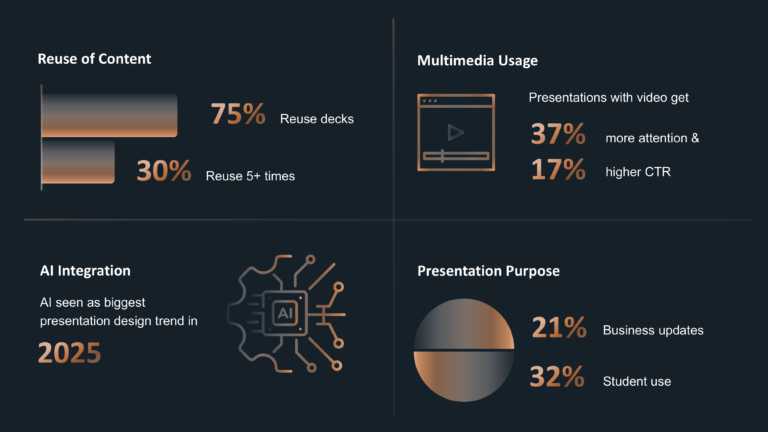
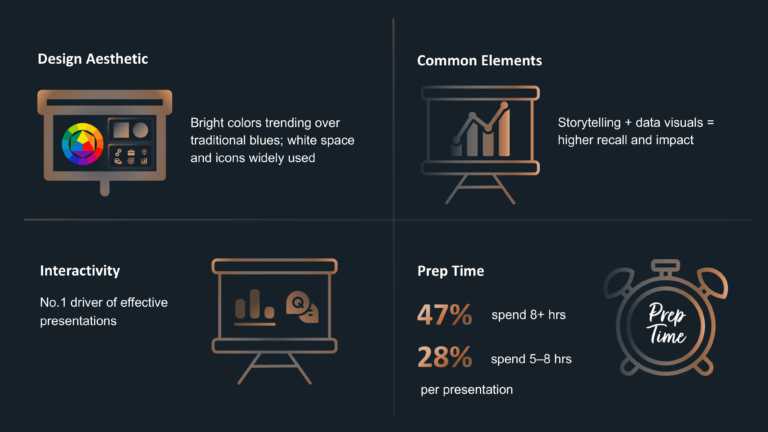
The vibrant color scheme blends cozy shades, with a design to keep your viewers interested and involved. Infographics like pie charts and bar graphs are cleverly positioned to illustrate information about software utilization patterns, delivery methods, and typical presentation durations, simplifying data for easy comprehension.
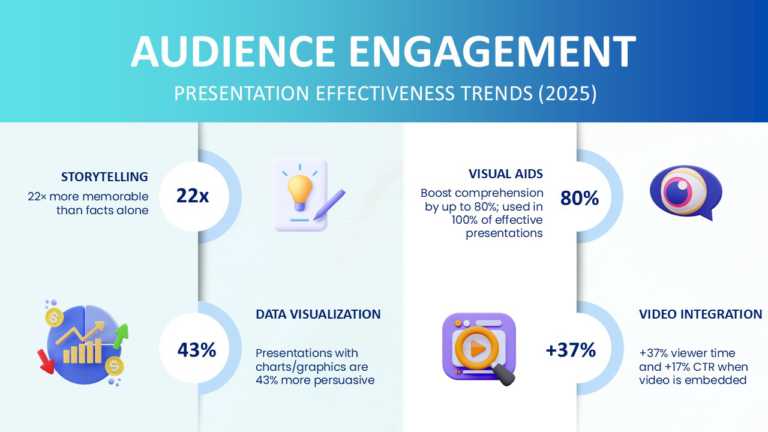
Perfect for business meetings or educational sessions, this template is designed for individuals looking to share data-driven insights. Emphasizing the power of storytelling motivates presenters to incorporate visuals in line with the growing practice of using 75 percent visuals for enhanced communication.
Enhance your presentations by downloading and incorporating statistics that will truly engage your audience. Find more such Google Slides for engaging presentations.


