Product Description:
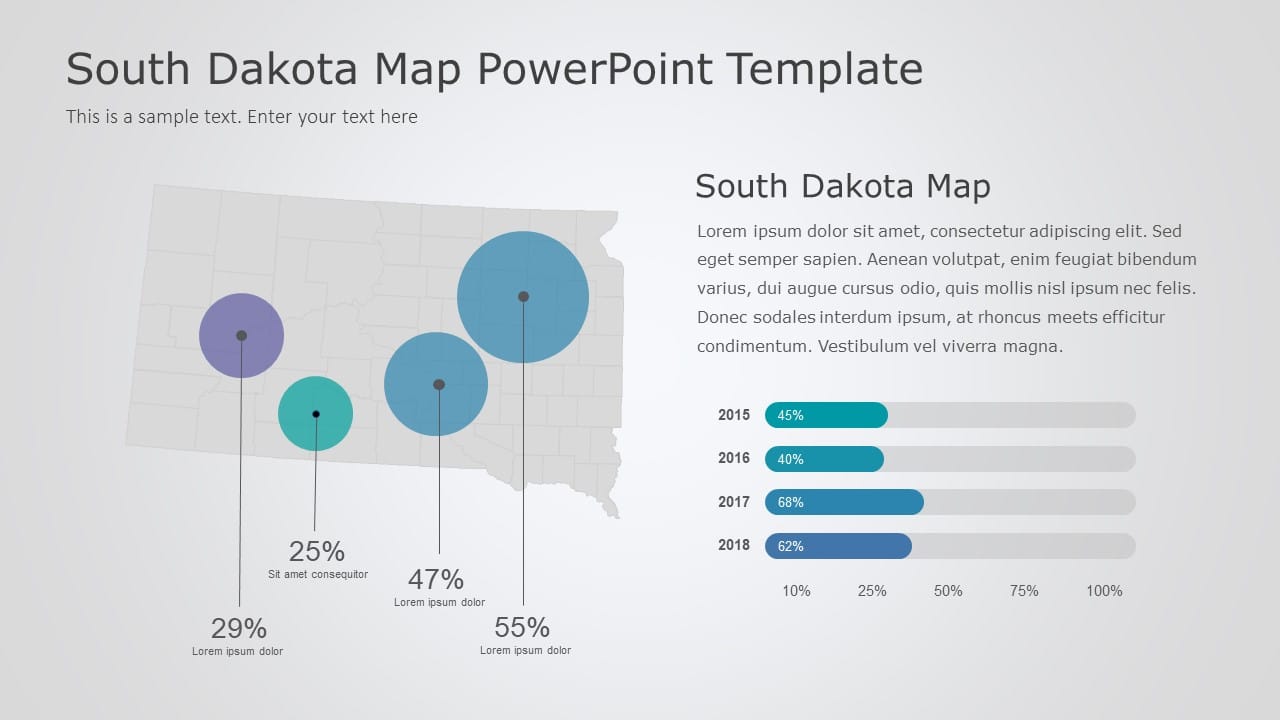
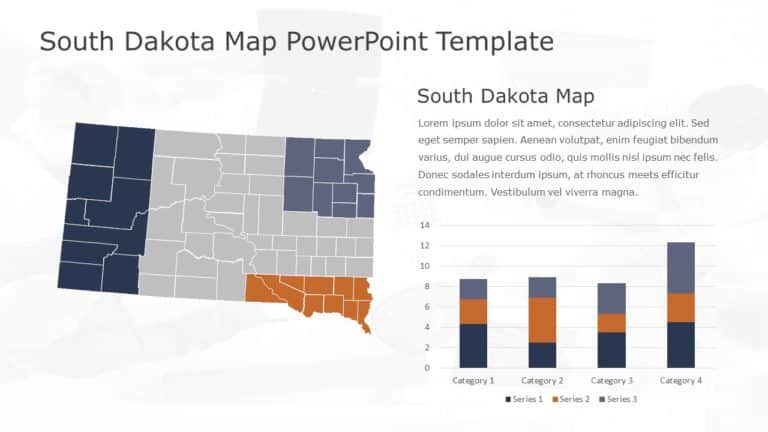
Share your ideas using this template for map analysis tailored for presenting data related to South Dakota specifically. This slide showcases an visually appealing design that incorporates a map, along, with circular data visualizations to easily emphasize important statistics and trends. The vibrant colors and unique infographic elements used here help keep your audience interested and involved in the presentation.
Perfect for individuals working in marketing or education fields and those involved in planning is this template that’s excellent, for showcasing demographic trends and project outcomes or for conducting strategic assessments efficiently and effectively using circular charts that make comparing data points simple and straightforward with text areas alongside, for offering comprehensive explanations or stories.
Whether you’re getting ready, for a meeting or gearing up for a school presentation or even getting set for a community talk. This template is your go to solution to make sure your message hits the mark with style and impact. Find more such Map PowerPoint templates for engaging presentations. These templates are compatible with both PowerPoint and Google Slides.


