Product Specifications Presentation Template Use this Product Specifications PowerPoint template to create visually appealing presentations in an....
CSR Partners Presentation Template Use this CSR Partners PowerPoint template to create visually appealing presentations in any professional setti....
Table of Contents Presentation Template Use this Table of Contents PowerPoint template to create visually appealing presentations in any professi....
About Simple Recycle PowerPoint Template The best-in-class Simple Recycle Template for PowerPoint is a slide set with recycled logos designed in ....
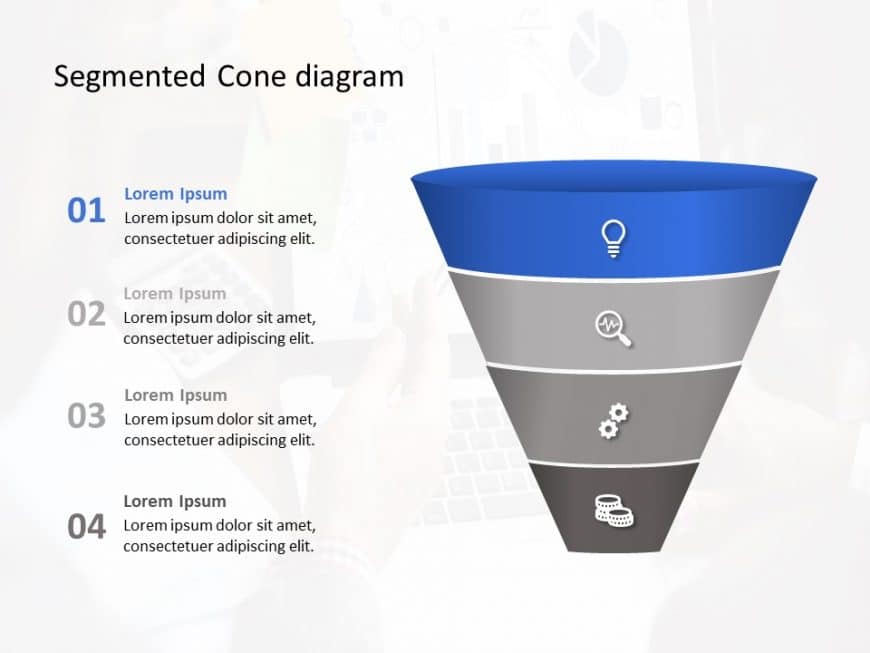
This free sales funnel template helps to showcase every step of the process of sales, purchasing, lead, or marketing. This is a free sales funnel....
About Marketing Strategy Presentation PowerPoint Template The Marketing Strategy Presentation PowerPoint Template helps professionals create c....
Enhance your effectiveness using this captivating node tree diagram template! Great, for representing concepts in a concise and structured way; t....
Great, for team meetings and discussions! This template provides a way to showcase connections and concepts visually. The distinctive flower shap....
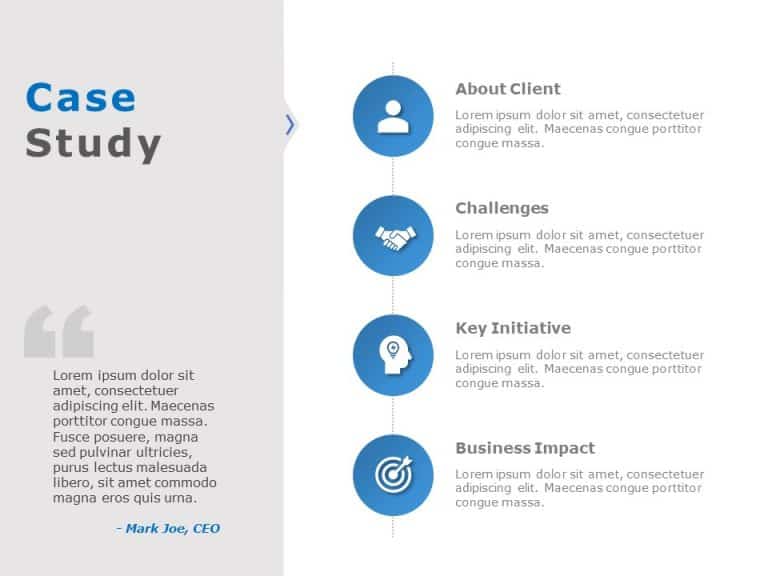
Elevate your meetings with this eye catching case study design template! Crafted in a blend of gray hues to highlight your clients achievements b....
The Animated Timeline 01 PowerPoint Template is a visually dynamic template designed to showcase chronological events or milestones in a presenta....
Business professionals and managers can make use of our 4-step ladder PowerPoint template to showcase the steps involved in the growth of their b....
Turn your information into, to understand visuals using this captivating diagram crafted specifically for business strategy discussions. This att....


