Product Description:
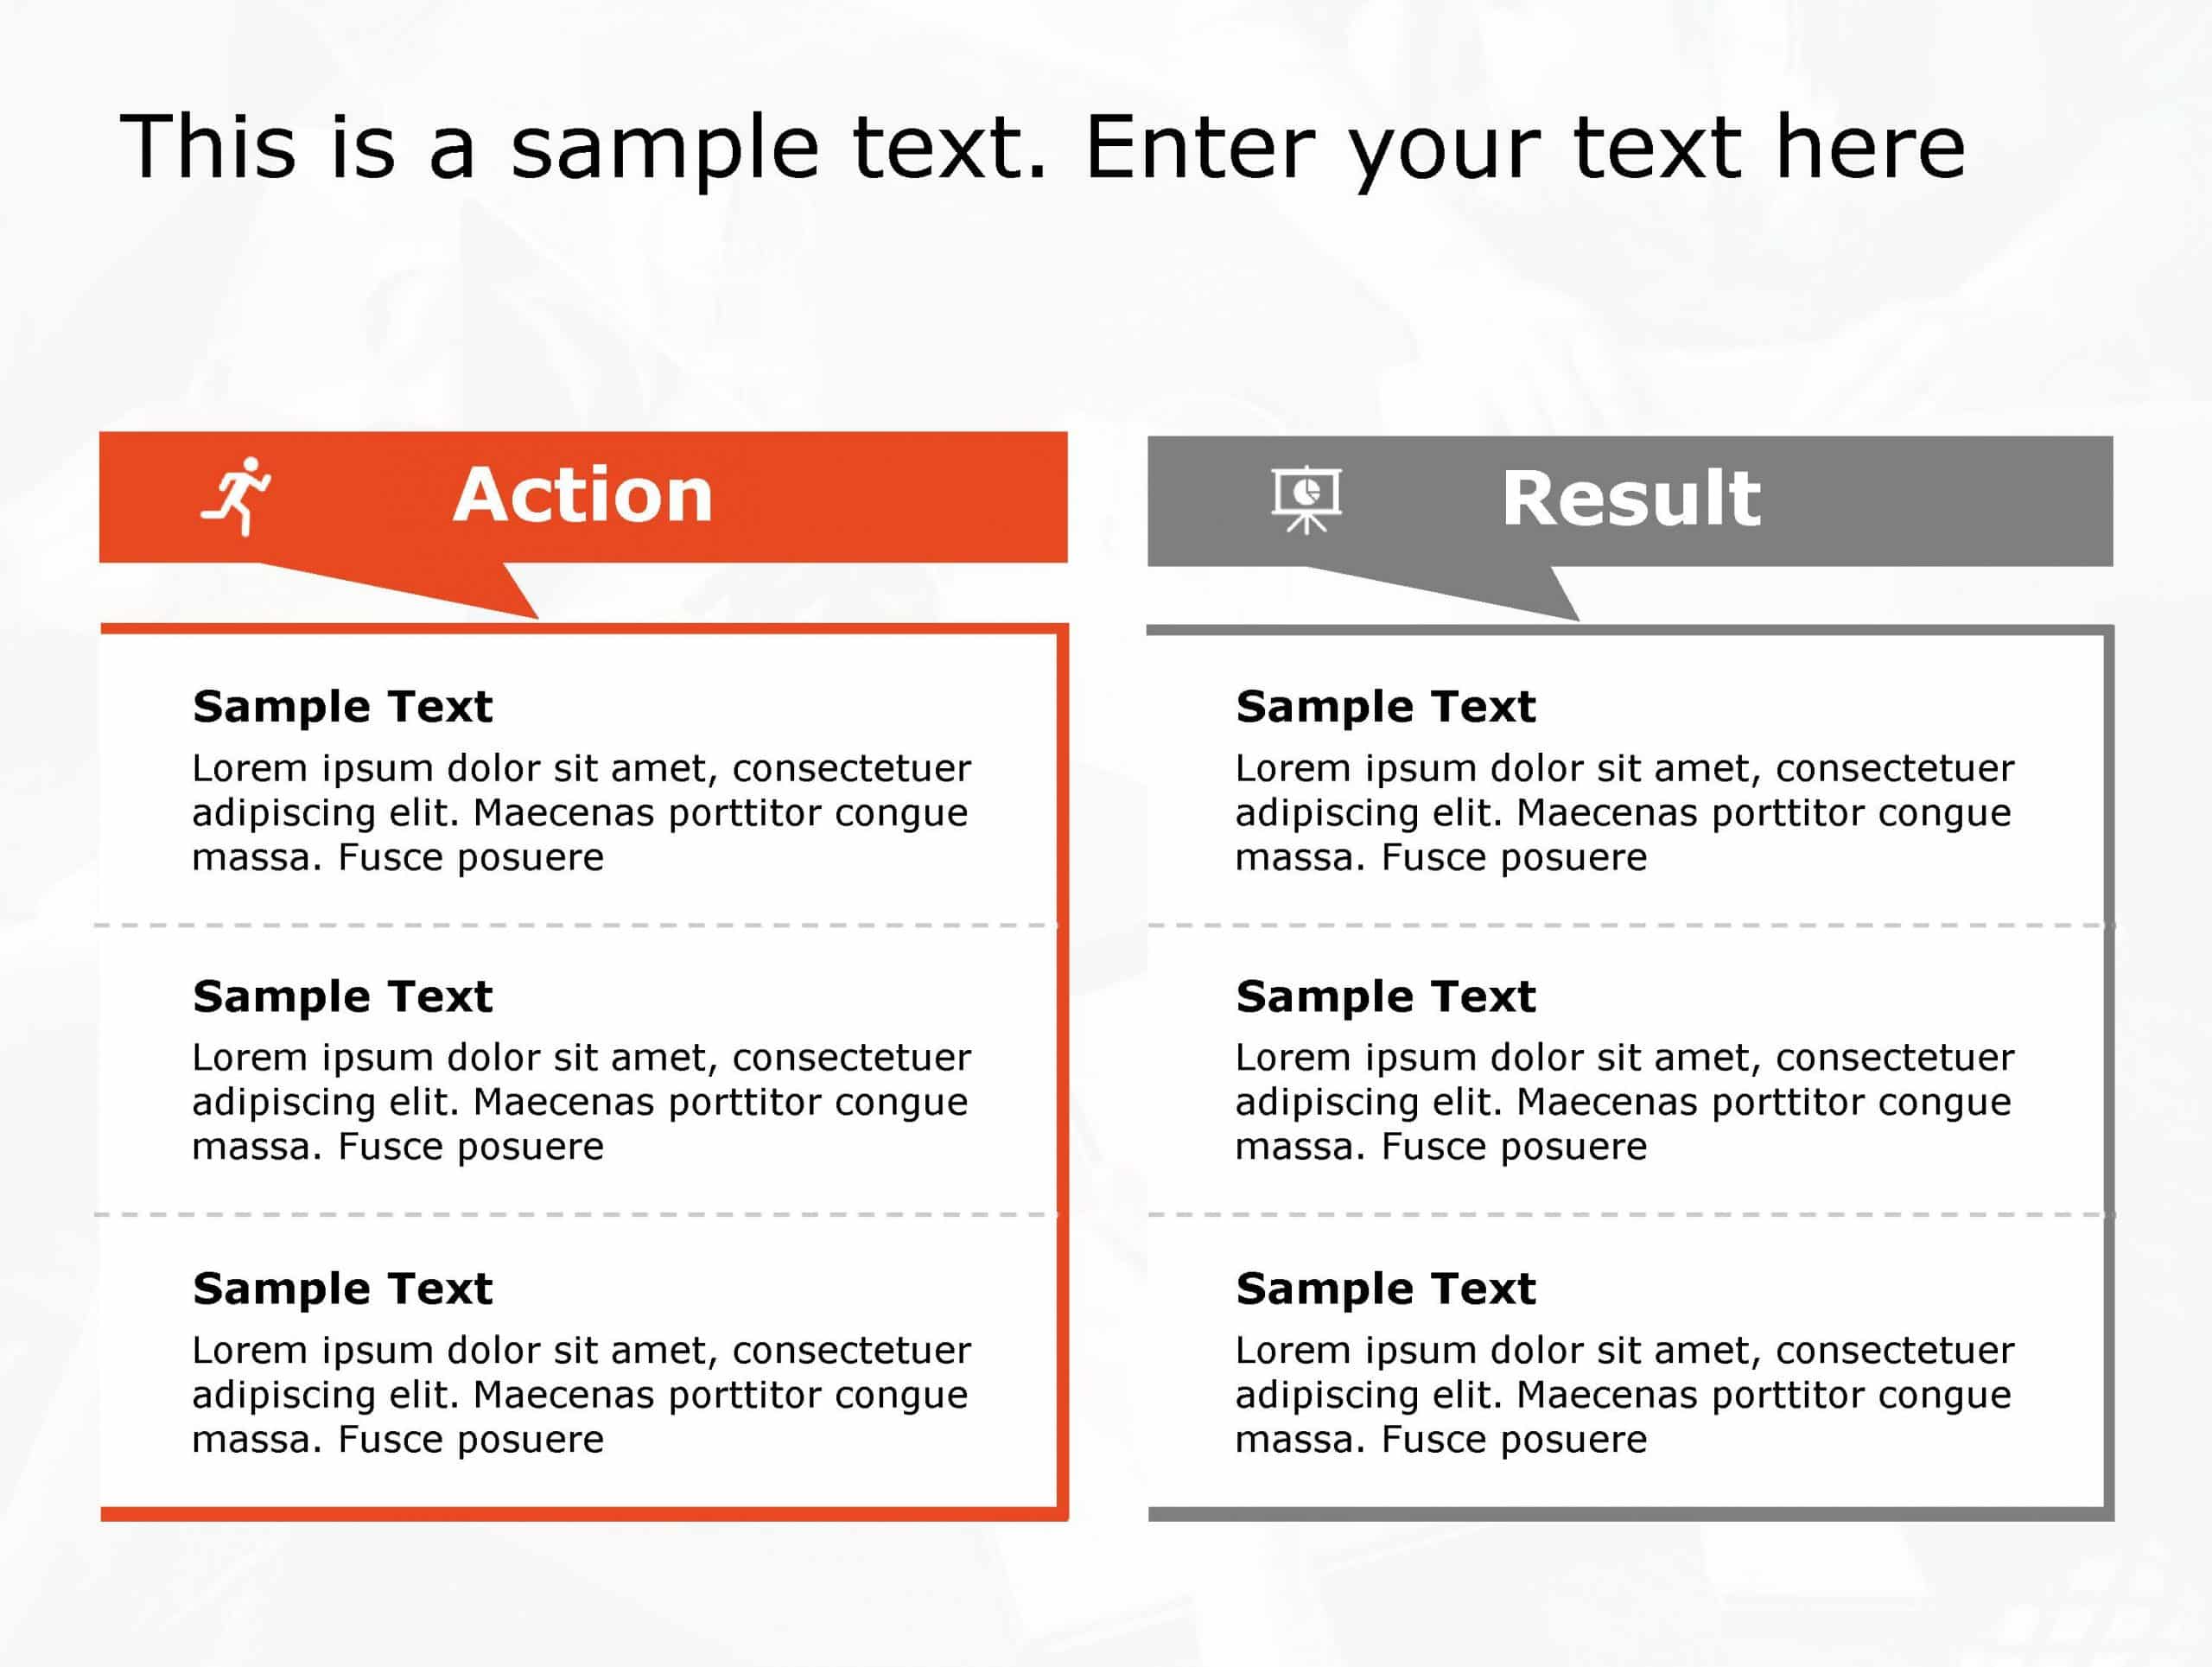
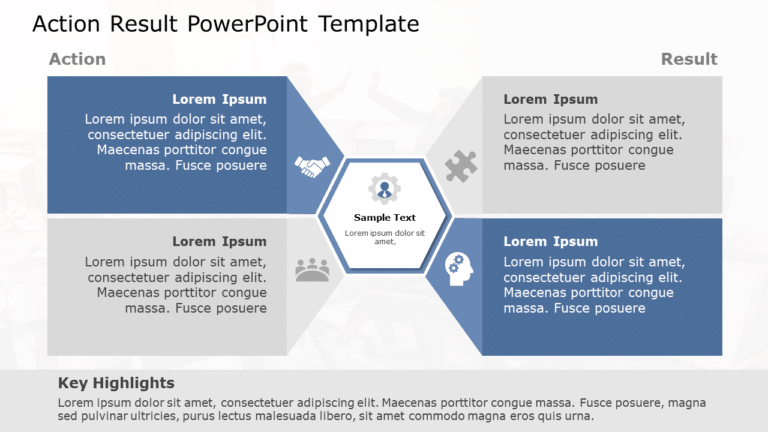
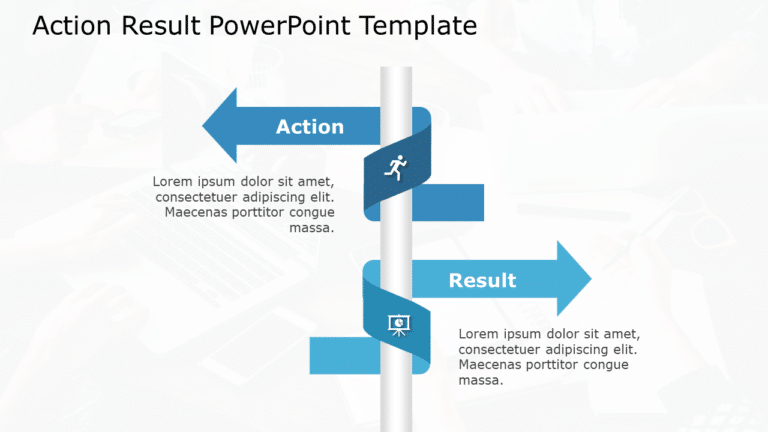
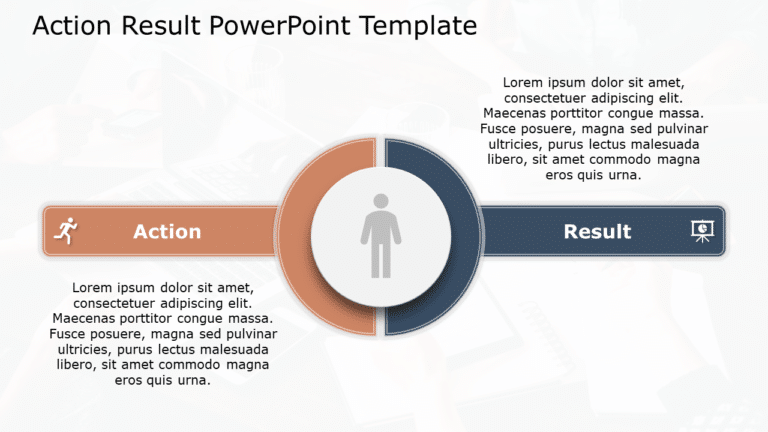
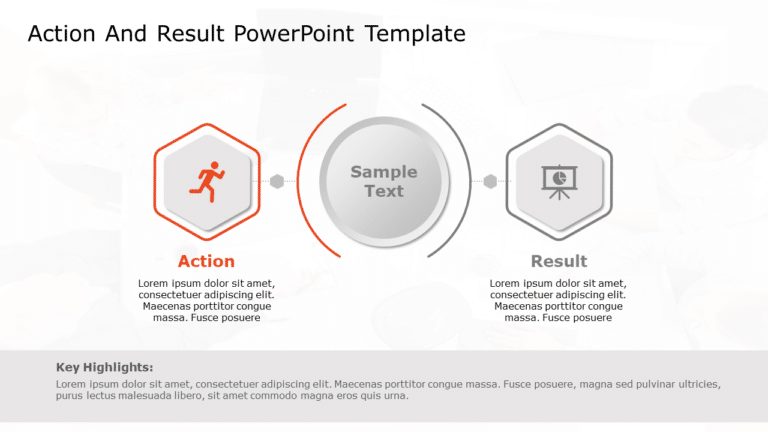
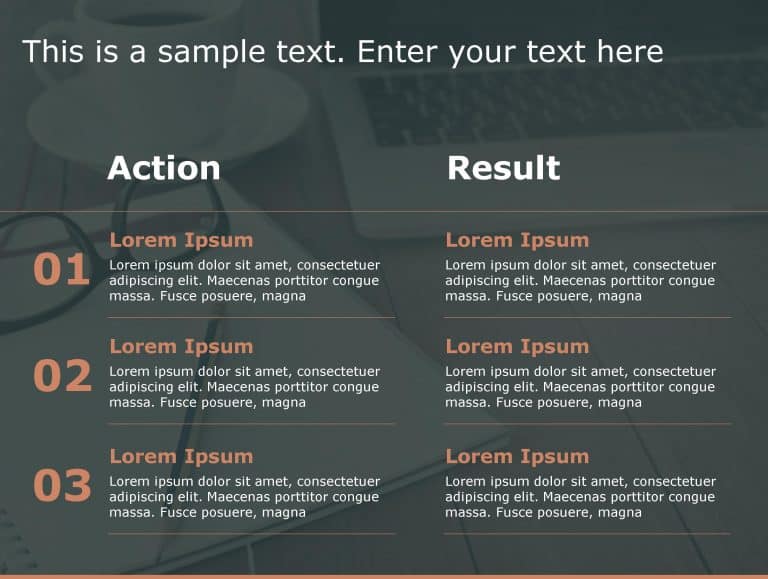
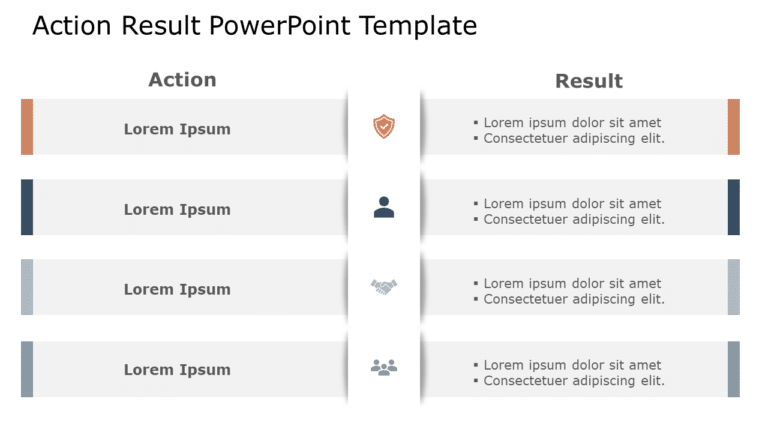
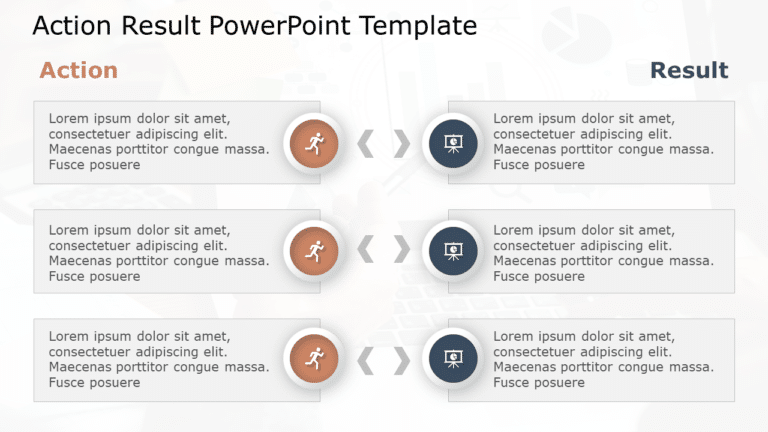
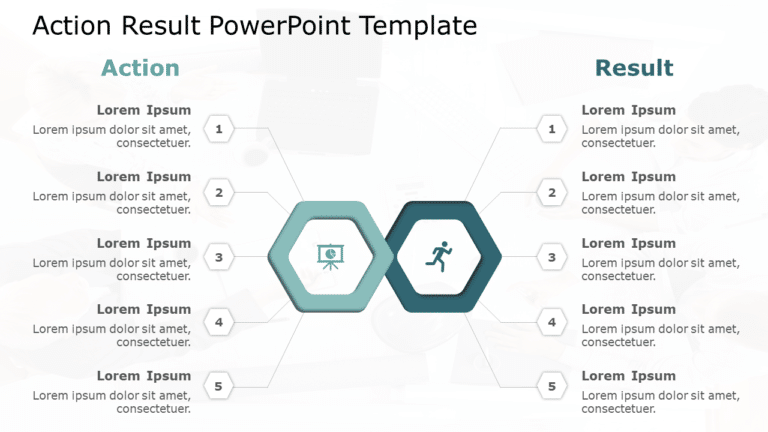
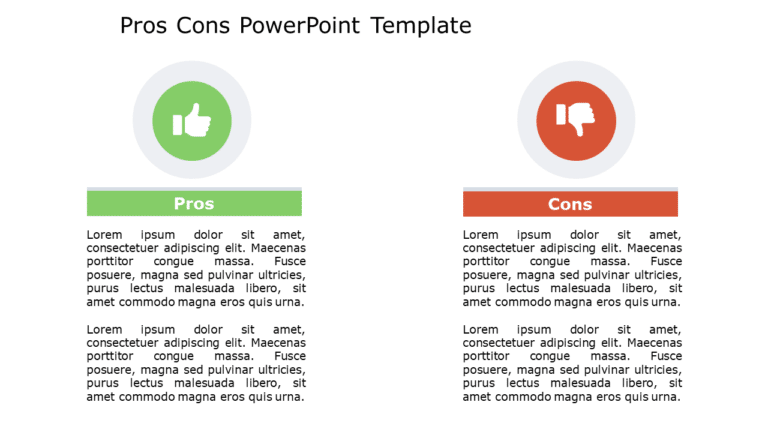
Enhance your storytelling using this comparison chart created to highlight actions and outcomes effectively. The chart showcases an sophisticated gray color palette, for an attractive visual display that is simple to comprehend. Its organized layout distinguishes between actions performed and the resulting outcomes distinctly making it ideal, for project leaders, teachers or business experts aiming to data in a manner.
Each segment enables text inputs, for comprehension by your readers promptly in an infographic format that boosts comprehension and guides viewers through your story with clear headings – perfect, for team gatherings or project assessments and educational slideshows to express your message clearly and effectively.
Get your hands on it today. Turn your presentations into narratives that connect with your viewers! Find more such Pmo PowerPoint templates for engaging presentations. These templates are compatible with both PowerPoint and Google Slides.

