Product Description:
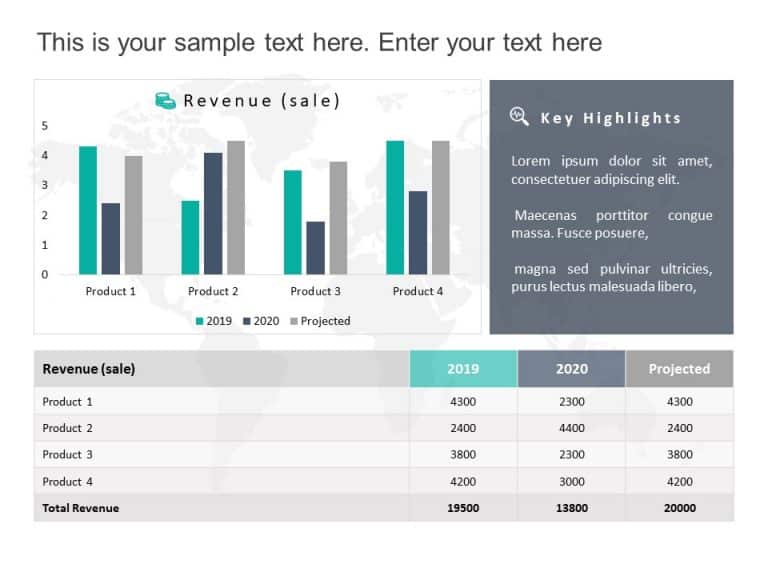
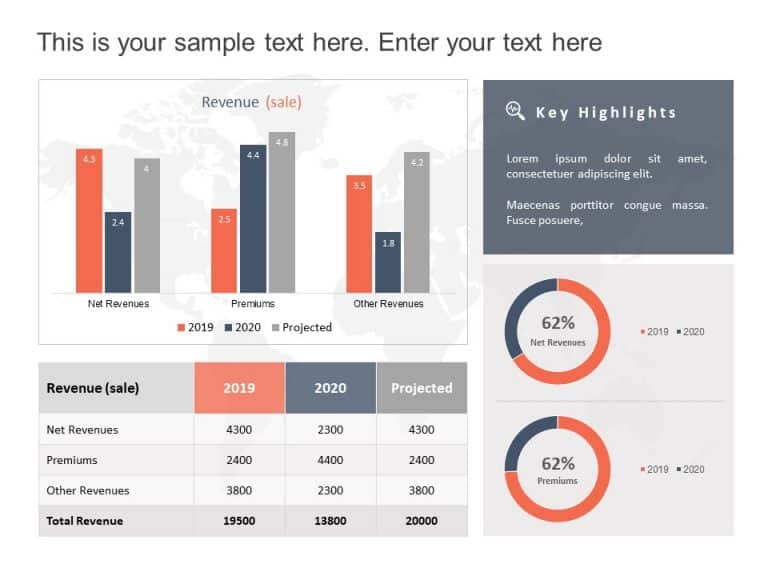
Enhance your presentation, with a revenue analysis dashboard that captivates your viewers and communicates financial information effectively! With its eye catching orange and gray color palette and user friendly design this template not boosts appeal but also guarantees clear data presentation. It showcases bar graphs that compare revenues, premiums and other income streams over various years making it ideal, for financial analysts and business experts alike.
The table, below presents an overview of the revenue data for 2019 and 2020 well as projected sales figures for easy comparison purposes, during corporate meetings or investor presentations that emphasize financial performance analysis.
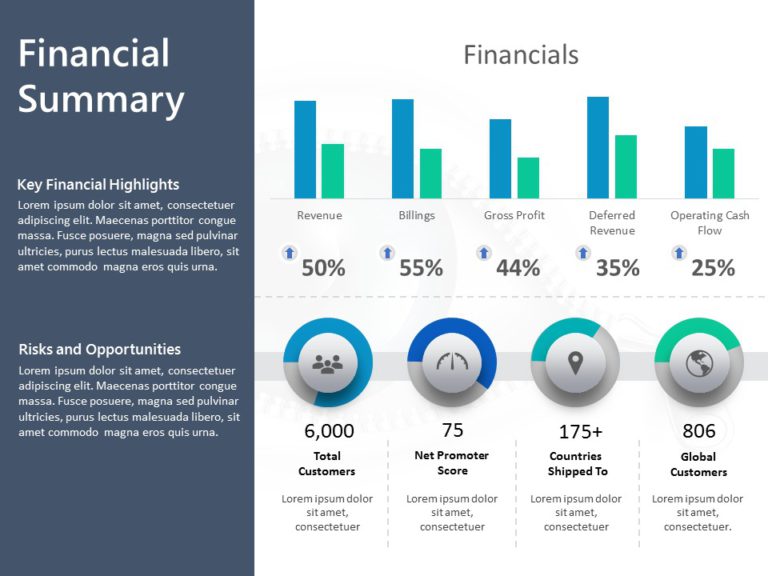
Enhance your presentations with embedded infographics that feature progress indicators to showcase essential metrics instantly and download today to take your presentations up a notch! Find more such Finance PowerPoint templates for engaging presentations. These templates are compatible with both PowerPoint and Google Slides.


