Product Description:
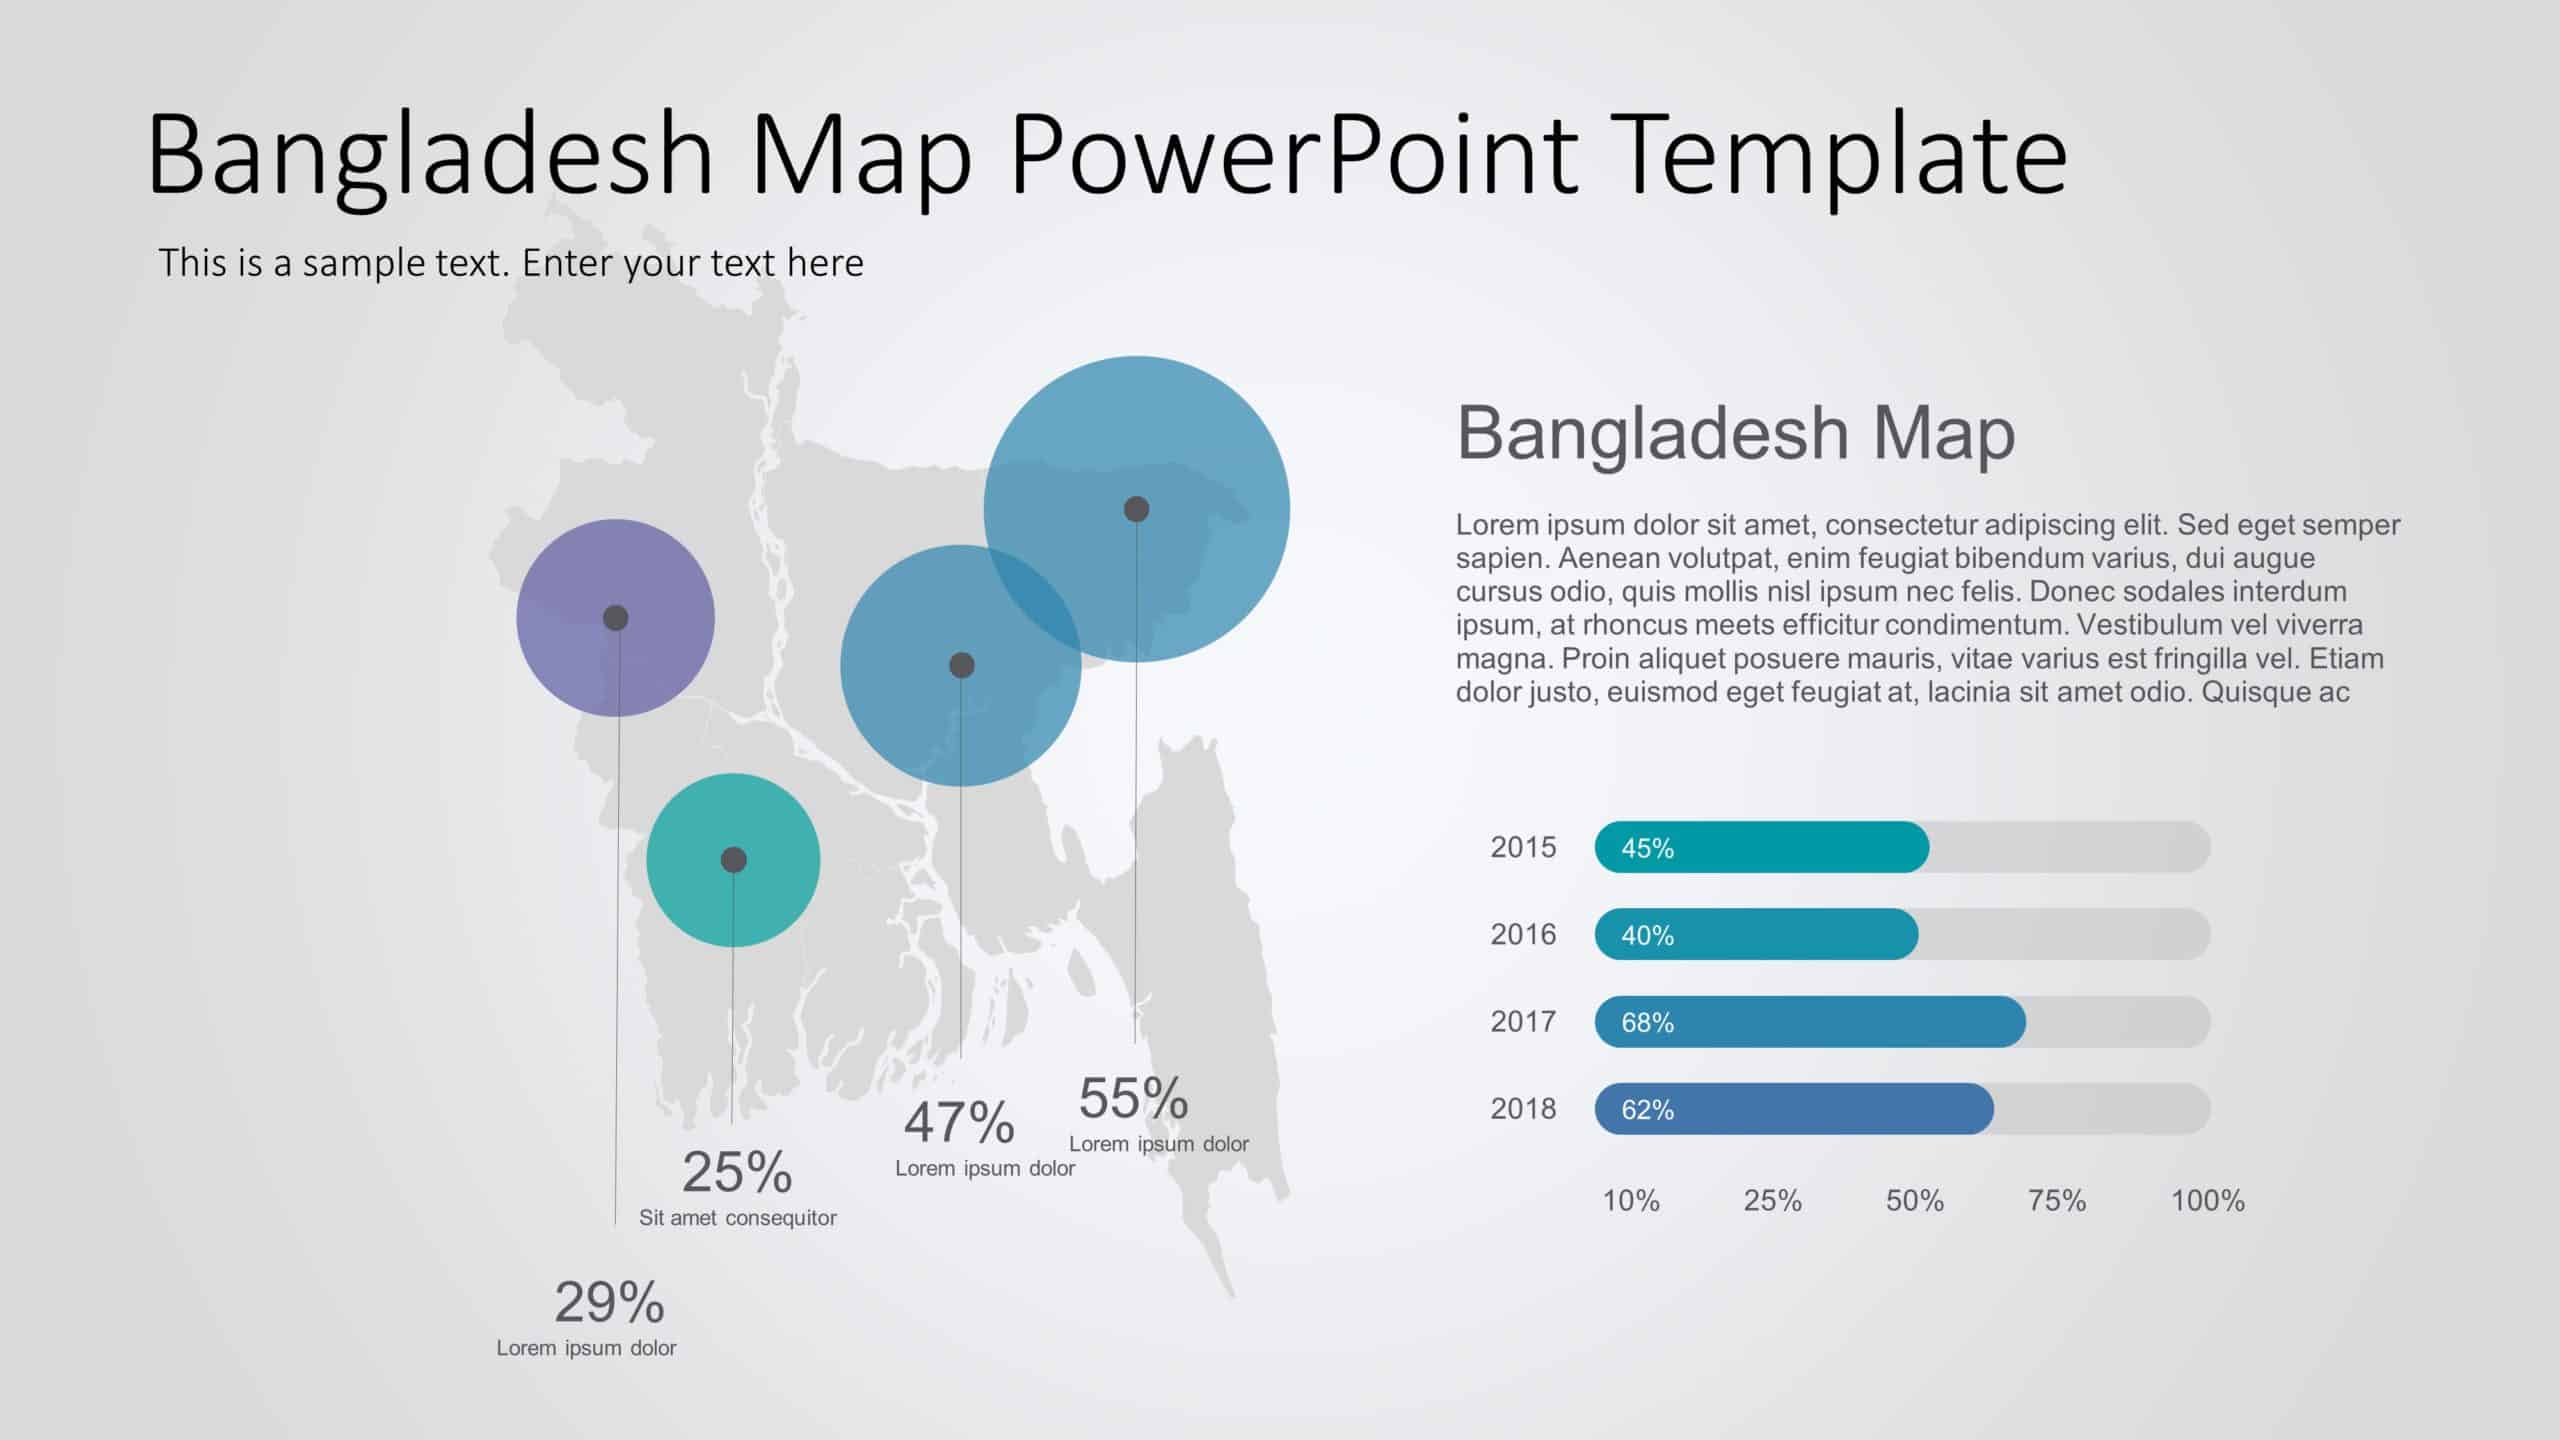
Perfect for team briefings, this template offers a visually engaging way to present geographical data about Bangladesh. The unique combination of teal and purple data circles enhances the clarity of your information, making it easy for your audience to grasp key statistics at a glance. The map layout allows for effective location-based analysis, ideal for professionals in sectors like marketing, logistics, and education.
With its clean design and intuitive infographic elements, this template is perfect for showcasing trends, demographics, or project progress over the years. The accompanying bar graphs provide a clear visual representation of data changes from 2015 to 2018, making it suitable for presentations that require detailed analysis.
Whether you’re a corporate professional, educator, or researcher, this template will elevate your presentations and help you communicate complex information simply and effectively. Download now to transform your data into compelling visual stories! Find more such Map PowerPoint templates for engaging presentations. These templates are compatible with both PowerPoint and Google Slides.


