PowerPoint Chart Templates For Efficient Data Visualization

Power Point charts are used to visualize large data sets in a presentation. PPT charts and graphs are great for displaying facts and statistics in business or marketing presentations.

Use this Market segmentation PowerPoint template to create visually appealing presentations in any professional setting. Its minimalistic design ....

Project Management Lifecycle 2 Presentation Template Use this Project Management Lifecycle 2 PowerPoint template to create visually appealing pre....

Key Financial Assumptions 1 Presentation Template Use this Key Financial Assumptions 1 PowerPoint template to create visually appealing presentat....

Competitor Analysis 12 Presentation Template Use this Competitor Analysis 12 PowerPoint template to create visually appealing presentations in an....

Performance graph 3 Presentation Template Use this Performance graph 3 PowerPoint template to create visually appealing presentations in any prof....

Investment Strategy 3 Presentation Template Use this Investment Strategy 3 PowerPoint template to create visually appealing presentations in any ....

Heat Map Presentation Template Use this Heat Map PowerPoint template to create visually appealing presentations in any professional setting. Its ....

Performance graph 2 Presentation Template Use this Performance graph 2 PowerPoint template to create visually appealing presentations in any prof....

Financial ratios Presentation Template Use this Financial ratios PowerPoint template to create visually appealing presentations in any profession....

Profitability ratios Presentation Template Use this Profitability ratios PowerPoint template to create visually appealing presentations in any pr....

Cash flow statement Presentation Template Use this Cash flow statement PowerPoint template to create visually appealing presentations in any prof....

Cash flow statement 1 Presentation Template Use this Cash flow statement 1 PowerPoint template to create visually appealing presentations in any ....

Related Presentations

Why Use Our PowerPoint Charts Templates?

From being visually appealing to 100% customizable, there are several reasons why you should choose our PowerPoint and Google Slides chart templates. Be spoilt for choice with our collection of charts for PowerPoint! 

1. Diverse Chart Types: Our chart PowerPoint templates help you present complex data in an aesthetic manner by converting it into meaningful PowerPoint chart design options like bar charts, line charts, pie charts, PERT charts, and more.

2. Compatibility: The charts themselves can be easily modified if linked to Excel by editing the data in the connected sheet and hitting update. 

3. Get a custom chart PPT: It is easy to be lost while trying to make the perfect presentation. Creating impactful presentations with data and charts takes time and expertise. Our presentation design services are here to help. Our experts will work with you to create a presentation suited for your audience.

Why Use Our Creative Chart Presentation Templates?

Here are some scenarios where you can use our PowerPoint chart templates:

1. They can be used to show trends and patterns over time, such as sales figures, website traffic, or stock prices. 

2. A presentation chart can also be used to compare and contrast different categories or groups, like product sales or market share

3. Additionally, creative PowerPoint graphs can highlight key metrics and performance indicators, making it easier to track progress and identify areas for improvement.

4. For complex datasets, PPT charts can simplify information and reveal underlying patterns. 

5. They can be used to visualize large datasets, such as website click-through rates or survey results, in a clear and concise manner.

Product Pricing

Can I Add Multiple Data Series To PowerPoint Chart Templates?

Yes, you can add multiple data series to a PowerPoint chart template.

1. Select the chart and go to “Chart Tools.”

2. Click on the “Design” tab, then select “Edit Data.”

3. Click on the plus button to add a new data series.

Which Are The Best PowerPoint Graphs Templates To Use?

PowerPoint graph templates help your audience understand the relation between distinct data sets. You can make a presentation graph to tell a compelling story and effectively communicate complex financial data and trends. Here are some of the main presentation charts that may be used for efficient data presentations so that you can grasp how data can be usefully illustrated.

1. Bar Chart: A PowerPoint bar graph chart displays changes and patterns throughout time. These are best suited for surveys, assessments, or statistics.

2. Pie Chart: A pie chart in PowerPoint is used to show percentages of a whole. They are best suited for market shares, election outcomes, etc.

3. Line Chart: You can showcase event and value progression using a PowerPoint line graph, suited for stock prices, for instance.

4. Radar Chart: Radar charts visually compare and contrast data sets.

5. Waterfall Chart: A PowerPoint waterfall chart visually tracks the cumulative effect of sequential positive and negative values on an initial value.

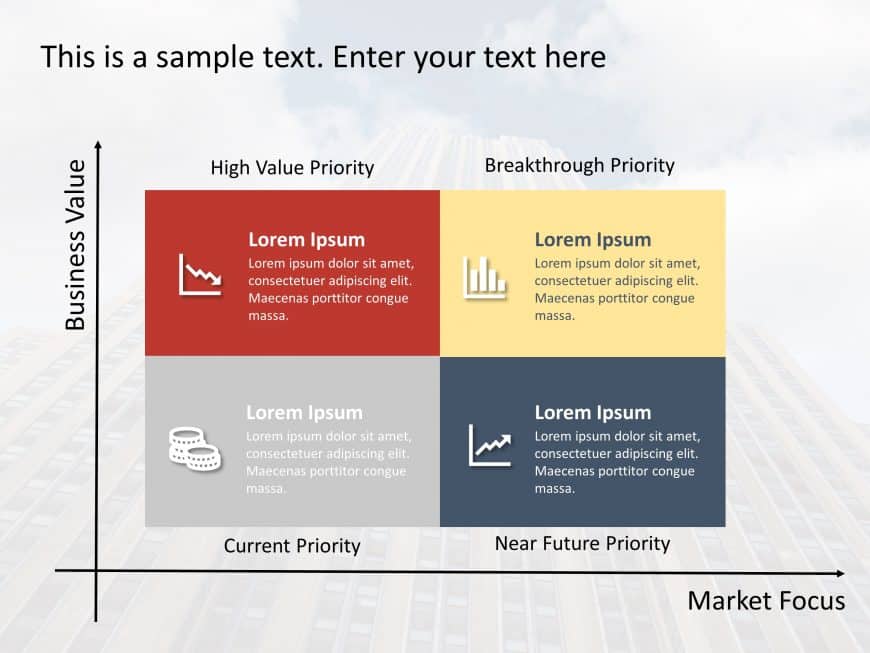
6. Quad Chart: A quad chart PowerPoint template is a visual tool that divides information into four quadrants for a concise overview, typically used for strategic planning or project management.

Can I Import Data From Excel To Charts In PowerPoint?

Yes, you can import data from Excel to our PowerPoint chart templates:

1. Open the Excel file with the data you want to use, select it, and copy it.

2. Go to your PowerPoint presentation.

3. Select the chart to which you want to add the data, and then paste the data into the chart.