Product Description:
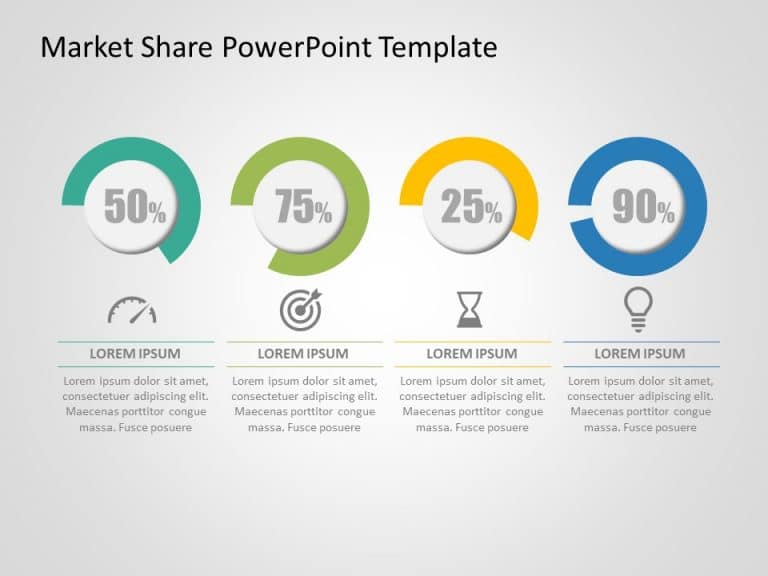
Enhance your presentation using this eye catching template specifically created to simplify data representation in a visually appealing manner.You’ll find the color palette from gentle to blue quite effective, in emphasizing differences, among categories directly aiding your audience in quickly understanding essential information at first glance.
Great, for data analysts and business professionals alike! This template is designed to help you display performance metrics and survey findings in an easy, to understand format that makes presenting your data a breeze.
Whether you find yourself in a board meeting or engaged in a team discussion environment. This heatmap template can enhance your ability to convey data effectively by transforming numbers into visuals.
Get it today. Turn your data presentations into engaging stories! Find more such PowerPoint Map templates for engaging presentations. These templates are compatible with both PowerPoint and Google Slides.


