Product Description:
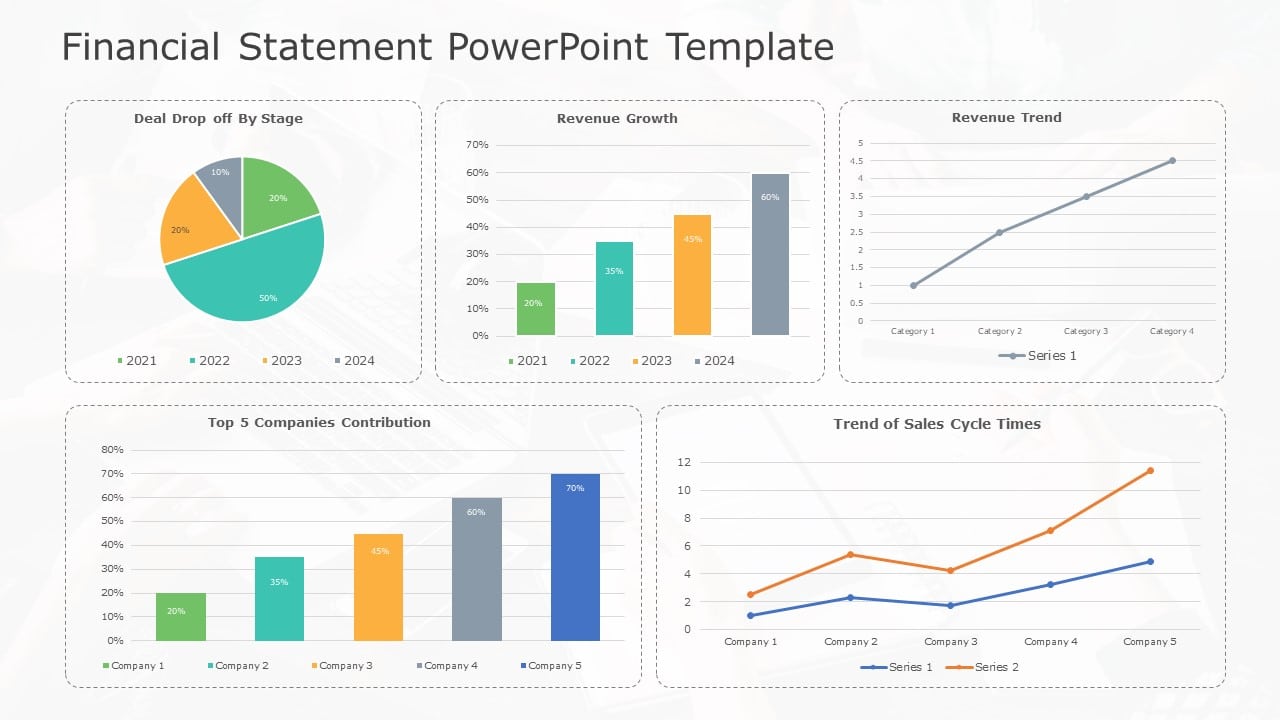
Create a story using this financial data display panel tailored for corporate assessment purposes.The design is well suited for individuals seeking to showcase information in an straightforward manner.A captivating pie chart showcases the decline, in deals at each stage effectively conveying the vitality of your sales pipeline over time.Moreover the bar graph depicting revenue growth offers a representation of your advancements making it perfect, for presentations focusing on performance metrics.
The design features charts, like revenue patterns and the five companies impacts that help you easily showcase important business factors. The sales cycle duration trend graph provides a look at performance variations. Serves as a valuable resource, for strategic conversations.
This template is perfect, for professionals and business analysts, with its design and user friendly visual aids. Grab it now to enhance your financial presentations effortlessly! Find more such Finance PowerPoint templates for engaging presentations. These templates are compatible with both PowerPoint and Google Slides.


