![]() Happy New Year
Happy New Year ![]() Flat 10% off on our Unlimited Access Yearly Membership plan!
Flat 10% off on our Unlimited Access Yearly Membership plan!


Org Chart PowerPoint Templates For Presentations
Free Org Chart PowerPoint Templates


This Line Organization Structure template represents the organizational structure, where authority flows vertically from top to bottom in a clear, direct line. It shows the hierarchy of an organization and its roles. This Organizational Chart template features a box at the center that is divided into two sections. These sections are divided into smaller boxes in a two-layer structure to...
read more
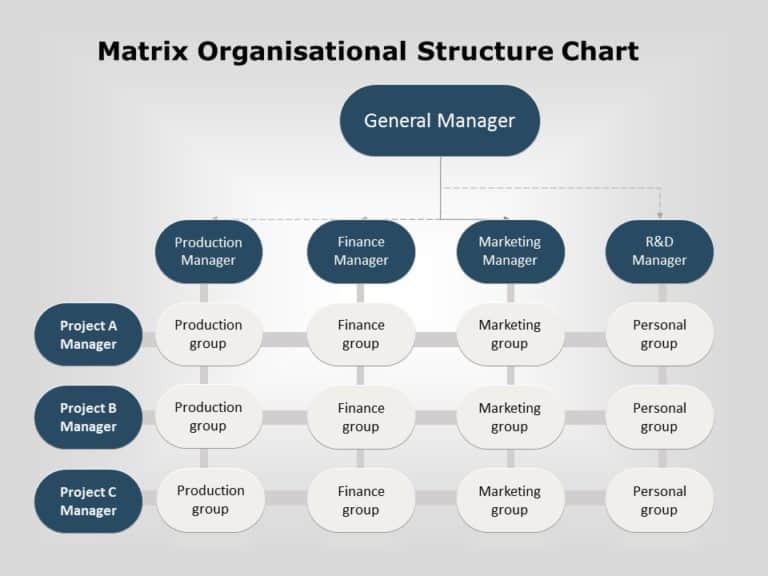
Elevate your meetings with this appealing chart template that features a modern blue and gray design scheme – an ideal tool, for business professionals aiming to improve team collaboration and communication effectively. The design highlights an order by displaying the connections, among the General Manager and different department leaders such as Production Manager Finance Manager Marketing Manager and R&D Managers...
read more
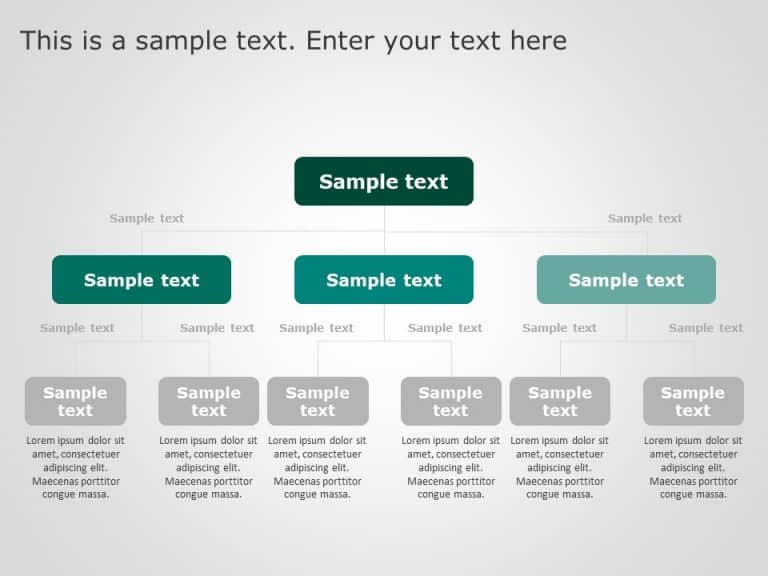
The Organization Structure With Spheres and Rectangles PowerPoint Template is a simple presentation template that can be used to recognize roles and assign responsibilities to team members. The use of vibrant colors and shapes helps make a visual impact and resonate with the audience. The template features a plain gray background, which helps eliminate distractions and create negative space to...
read more
PowerPoint Org Chart Templates
")
This Project Team Organizational Chart template helps professionals outline and manage the structure of a team working on a specific project. It ....

Org Chart is an effective tool that professionals and businesses can use to showcase their team members or the structure of an organization’....

This Matrix Organizational Chart template shows a hierarchical system where employees report to the functional manager and the project manager. I....

The Circular Organization Structure Template is an easy-to-understand and visually unique template that can be used to show the hierarchical brea....

Use this Company Org Chart template to create visually appealing presentations in any professional setting. Its minimalistic design and ready-to-....

Crafted to improve clarity and make an impression, on your audience; this template elevates your presentations by offering a defined organization....

Ideal, for team meetings is this template that provides an interesting method to display your companys hierarchy composition effectively The circ....

Showcase your project teams effectively, with this Free template that will impress stakeholders! This slide layout provides an organized method f....

The Org Chart Template is a neat, well-organized, and easy-to-understand template that can be used to set a defined flowing structure for an orga....

The Circular Org chart is identical to the standard org chart; the only difference is the shape. The circular org chart has a circular framework ....

This project team leadership slide is a brief visual representation of project teams to showcase the roles and responsibilities of the team membe....
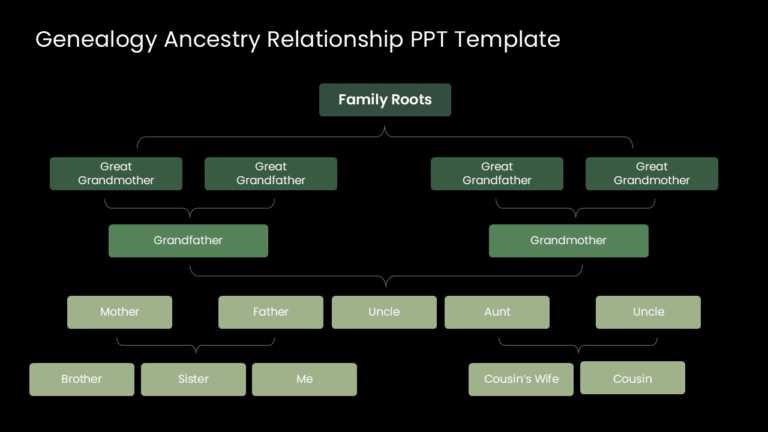
Craft a clear narrative with this engaging genealogy ancestry relationship template. Perfect for family historians and genealogists, this visuall....
Related Presentations
-

Human Resource
992 templates>
-

Leadership
255 templates>
-

Meet The Team
103 templates>
-

Business
6,389 templates>
-

Professional
8,023 templates>
What is an Org Chart template?
An Org Chart template is a pre-designed slide or diagram that helps you visually display the structure of an organization. It shows how teams are organized, who reports to whom, and how different roles connect within a company. Instead of building an org chart from scratch, you can use a ready-made template to quickly create a polished and professional visual that’s easy to edit and share.
Org Chart templates are commonly used in PowerPoint themes presentations for onboarding, team introductions, leadership updates, restructuring announcements, and more, across industries like corporate, healthcare, education, government, and nonprofits.
How to Effectively Customize an Organizational Chart PowerPoint Template?
Customizing an org chart template PowerPoint is easier than you might think. Follow these simple steps to create a clear and professional PowerPoint hierarchy chart template that perfectly represents your team structure.
- Step 1: Choose the Right Template. Start by selecting an organizational chart template PowerPoint that fits your team size and structure. Look for a layout of online templates under the File tab that matches your purpose — whether it’s for a small team, an entire company, or a department. First of all, the format should be chosen that is closest to the structure of your organization.
- Hierarchical Org Charts – Applicable to most corporations with a clearly defined management structure.
- Matrix Org Charts- They are for use in organizations with functional departments and several reporting structures.
- Flat Org Charts – Most appropriate for companies with low levels of management or structure, such as startups and small businesses.
- Step 2: Insert Your Content: Click on the placeholders in the template to add your own information. Replace sample names, titles, and departments with your actual team members and roles.
- Step 3: Add or Remove Boxes: Customize the chart to fit your organization.
- To add new positions or team members, duplicate a box and drag it into place.
- To remove any unnecessary boxes, simply select and delete them.
- Step 4: Adjust Layout and Hierarchy: Drag boxes or use built-in tools (SmartArt or connectors) to adjust reporting lines or team structure. Make sure the hierarchy is clear and logically organized.
- Step 5: Personalize the Design: Customize fonts, colors, and box styles to match your brand or presentation theme. You can also add photos or icons for a more engaging and personalized look.
- Step 6: Review for Clarity: Check that names, titles, and connections are correct and easy to read. Make sure the layout is balanced and doesn’t feel too crowded or too sparse.
- Step 7: Save and Share
Once you’re satisfied with the org chart, save your PowerPoint presentation. Now you’re ready to present it during meetings, share it with your team, or send it to stakeholders.
What are the key elements to include in an org chart template powerpoint?
Here are the important elements to include in a practical, effective organizational chart template PowerPoint:
- Unmistakable Hierarchy Tiers: Visually distinct levels (e.g., C-suite → Directors → Managers → Staff) with consistent vertical/horizontal alignment.
Why it matters: Instantly communicates reporting lines and authority structure. - Drag-and-Drop Placeholder Boxes: Pre-sized, editable shapes with “[Name]” and “[Title]” prompts for zero-formatting updates.
Why it matters: Saves hours of manual adjustments when roles change. - Clean Connecting Lines: Adjustable arrows/links (not static lines!) that stay anchored when boxes move.
Why it matters: Maintains clarity as teams scale or restructure. - Integrated Branding: Pre-loaded company colors, fonts, and logo placeholders (not just blank slides).
Why it matters: Projects professionalism without extra design work. - Native PowerPoint Editing: Built with standard PPT shapes/SmartArt—not images or complex vectors.
Why it matters: It lets anyone edit it without specialized skills or plugins.
What are Advanced Org Chart Features for PowerPoint Users?
- SmartArt Tools: PowerPoint’s SmartArt feature allows users to create and edit organizational charts quickly. You can switch between different layouts, add hierarchy levels, and format shapes, alongside various illustrations, without manual drawing, making it a fast and flexible option for visualizing structures.
- Custom Connectors: For more complex structures that go beyond a simple top-down hierarchy, PowerPoint offers customizable connectors. These let you show dotted-line relationships, cross-functional links, or matrix-style structures with precise control over line placement.
- Animation and Transitions: Advanced users can apply animations to reveal org chart levels gradually, helping guide the viewer’s attention. Transitions like Morph or Fade can also be used between org chart slides to enhance flow and engagement during presentations.
- Interactive Hyperlinks: PowerPoint allows you to embed hyperlinks in shapes or text. You can link each org chart box to individual slides, employee bios, or external resources—ideal for interactive team directories or onboarding decks.
- Design Customization Options: Beyond structure, Microsoft PowerPoint provides full control over design. You can change colors, fonts, and shapes to match your branding, or add photos and icons for a more engaging, personalized look that aligns with your company’s visual identity.
What are the common mistakes to avoid when designing an org chart template powerpoint?
- Overloading the Chart with Information: Trying to fit too many details, like long job descriptions or personal info, can make the chart cluttered and hard to read. Stick to names, roles, and key hierarchy connections.
- Poor Visual Hierarchy: If reporting lines and leadership levels aren’t clearly defined, the chart becomes confusing. Use consistent box sizes, font styles, and connector lines to create a clear visual flow from top to bottom.
- Inconsistent Formatting: Mixing different fonts, colors, or box styles can make your chart look unprofessional. Maintain a consistent design throughout to ensure a polished and cohesive appearance.
- Neglecting Readability: Using small font sizes or cramped layouts makes it difficult for your audience to follow the structure. Leave enough space between elements and ensure text is large enough to read easily, even when presented on a screen.
- Forgetting to Update the Chart: Outdated org charts can cause confusion, especially in fast-changing organizations. Regularly review and update the chart to reflect current roles and reporting relationships.
What are Industry-Specific Applications of Organisational Chart Templates?
The organizational chart template PowerPoint is an essential tool for business professionals across various industries, helping to visualize team structures and improve communication. Here’s how they’re commonly used in professional environments:
- Corporate Enterprises: Executives, HR leaders, and managers use org charts to present corporate hierarchy, streamline onboarding, clarify reporting relationships, and support organizational planning during restructures or mergers.
- Healthcare Organizations: Healthcare administrators and department heads leverage org charts to map complex organizational structures, improving coordination between clinical, operational, and administrative teams.
- Educational Institutions: School and university leaders utilize org charts to define administrative roles, academic departments, and governance structures, enhancing transparency for faculty, staff, and stakeholders.
- Professional Services Firms: Consultancies, law firms, financial services, and creative agencies rely on org charts to showcase leadership structures, team compositions, and project-based reporting lines—especially useful in client-facing presentations and internal management.
Where can I find free PowerPoint org chart templates?
SlideUpLift offers polished, professional org chart templates for PowerPoint, available both free and premium. These ready-to-use designs feature clear hierarchies, brand-aligned formatting, and effortless editing to save time. Ideal for businesses, HR, and nonprofits.
We have a free presentation templates library where you can explore all the free org chart template PowerPoint designs to quickly and easily visualize your organization’s structure. You can easily visualize your team structure with a professionally designed Organizational Chart Template Google Slides from our free templates library.
How can I customize an org chart template in PowerPoint?
Steps to Customize an Org Chart in PowerPoint:
- Insert SmartArt – Go to Insert > SmartArt > Hierarchy and pick a template.
- Edit Text – Click on shapes to add names/titles.
- Add/Remove Boxes – Use SmartArt Design > Add Shape or press Delete.
- Change Style – Adjust colors (Change Colors) and layouts (Layouts).
- Format Shapes – Modify fills, borders, and effects under Format Shape.
- Save/Export – Save normally or right-click to Save as Picture.
Quick Tip: Drag boxes to easily rearrange their positions.
What are the best PowerPoint org chart templates for team structures?
Classic Hierarchy– Traditional top-down structure.
Flat Org Chart– Modern, horizontal layout for agile teams.
Matrix Chart– Grid style for cross-functional roles.
Circular Chart – CEO-centered design with visuals.
Timeline Org Chart– Shows team evolution over time.
Source: Use PowerPoint’s SmartArt or premium sites like SlideUpLift for ready-made templates. (Clear, adaptable, and professional!)
Can I use a PowerPoint org chart template for employee hierarchies?
Yes! PowerPoint org chart templates are perfect for visualizing employee hierarchies—here’s why and how:
Why Use Them?
- Clarity: Show reporting lines, roles, and team structures at a glance.
- Professionalism: Pre-designed templates save time and ensure consistency.
- Flexibility: Easily add/remove levels (executives, managers, staff) as your team grows.
How to Adapt a Template:
- Choose the Right Template (e.g., Classic Hierarchy for traditional companies, Flat Chart for startups).
- Edit Text & Levels by clicking shapes to add employee names, titles, and departments.
- Customize Design with your company’s colors, logos, and branding.
Are there customizable org chart templates for PowerPoint available?
Yes! PowerPoint offers customizable SmartArt org chart templates. You can also download editable templates from sites like Slideuplift. Easily adjust colors, text, and structure to fit your team hierarchy.
What is an org chart in PowerPoint, and how do I create one?
An org chart in PowerPoint is a visual diagram that shows the structure of an organization, including team members, roles, and reporting relationships. It helps explain who works where and who reports to whom.
To create one, go to the Insert tab, click on SmartArt, choose Hierarchy, and pick a layout that fits your needs. Then, you can add names, job titles, and connect positions to reflect your team’s structure. You can also customize colors, shapes, and fonts to match your presentation style.
Why are org chart templates important for business presentations?
Org chart templates save time, ensure consistency, and make complex structures easy to understand. They help visualize hierarchies, clarify roles, and improve communication across teams.
Using a professional template also boosts credibility, simplifies onboarding, and keeps presentations polished—whether for stakeholders, clients, or internal planning. A clear org chart fosters alignment and efficiency in any organization.
How do I add multiple levels to an org chart in PowerPoint?
To add multiple levels to an org chart in PowerPoint:
- Insert SmartArt
- Go to Insert > SmartArt > Hierarchy and pick a template.
- Add Subordinate Levels
- Click a shape, then under SmartArt Design > Add Shape, choose:
- Add below (for direct reports).
- Add After (for same-level roles).
- Promote/Demote (to adjust levels).
- Click a shape, then under SmartArt Design > Add Shape, choose:
- Expand with Assistant Roles
- Use Add Assistant (under Add Shape) for special roles (e.g., executive assistants).
- Adjust Layout
- Right-click a shape > Layout to switch between Standard, Both, or Left Hanging for multi-tier alignment.
Pro Tip: Use Text Pane (click the arrow on the SmartArt border) to quickly edit levels in bullet-point format. (Keeps complex hierarchies clean!)
What are the benefits of using pre-designed org chart templates in PowerPoint?
- Saves time – No need to build from scratch.
- Looks professional – Clean, polished layouts.
- Handles complexity – Clearly shows multi-level teams.
- Easy to update – Add/remove roles in seconds.
- Keeps branding consistent – Match company colors/fonts.
How do I design a professional-looking org chart in PowerPoint?
To design a pro org chart in PowerPoint:
- Use SmartArt (Insert > SmartArt > Hierarchy) or a template from Slideuplift.
- Keep it clean – Limit text (name/title only), use uniform shapes/colors.
- Align perfectly – Use Design > Align for consistent spacing.
- Brand it – Add your logo, company colors, and fonts.
- Simplify complexity – Break large teams into linked slides or departments.