Product Description:
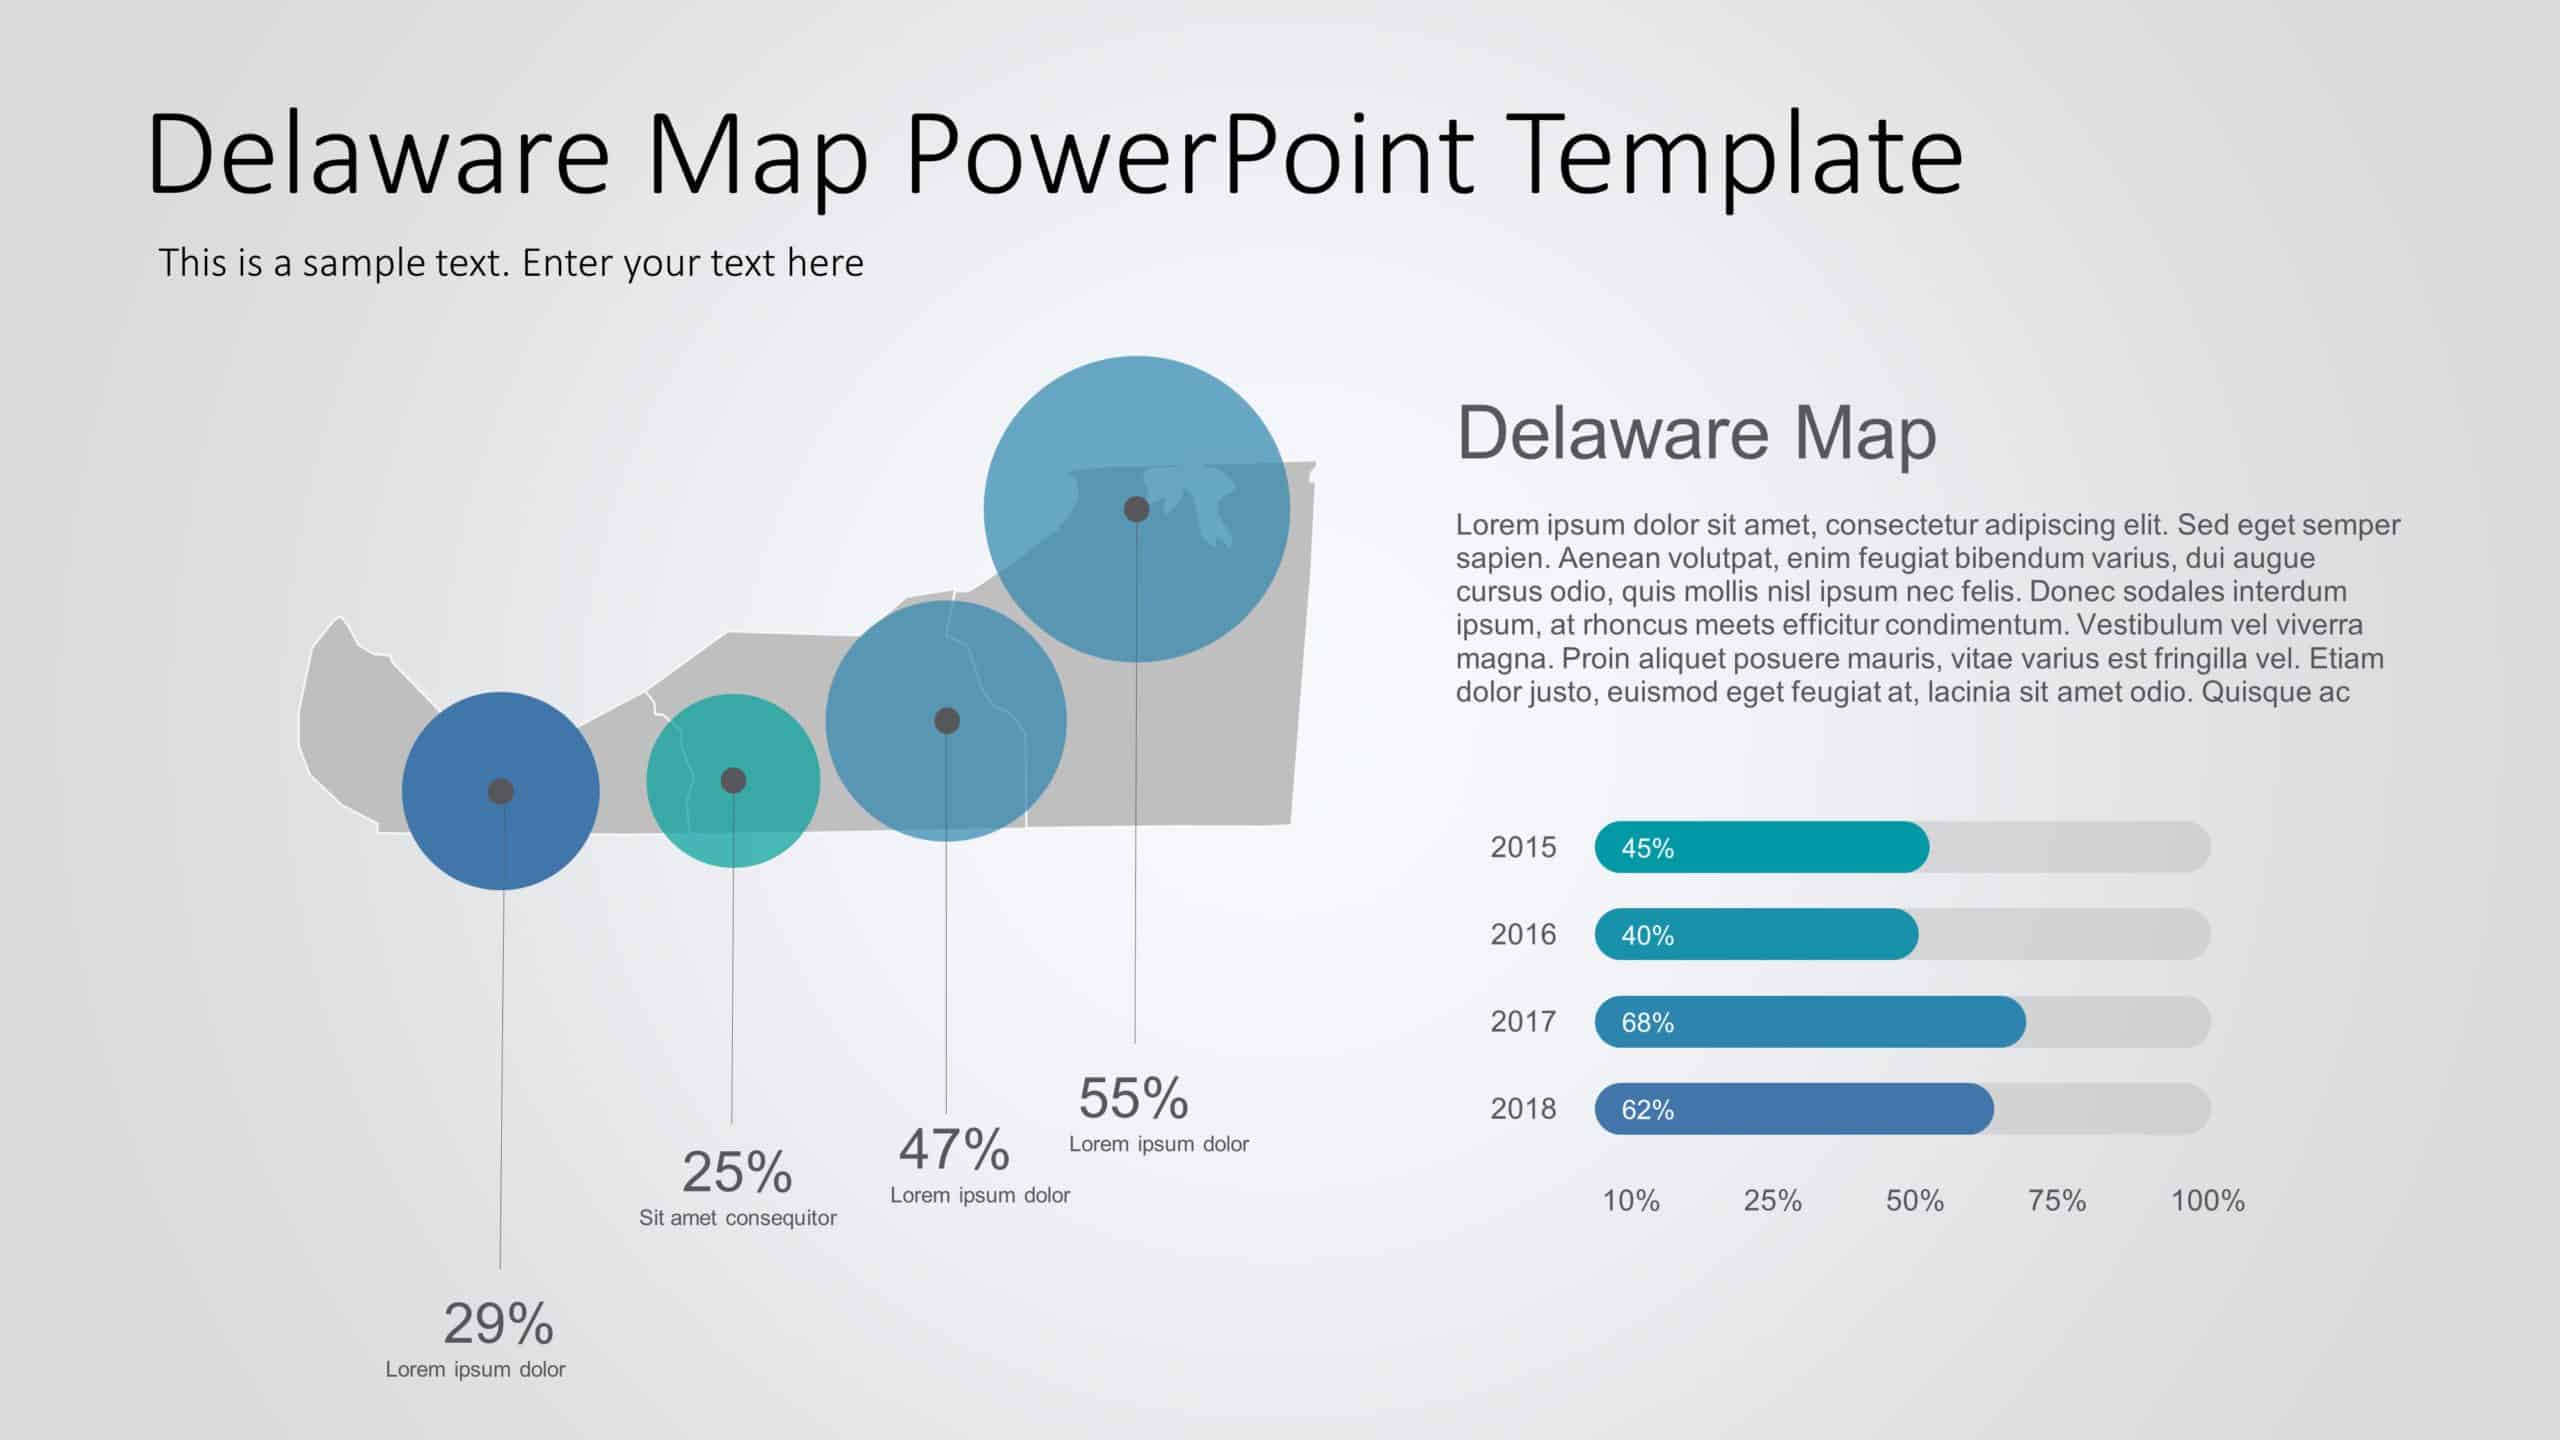
Bring your data to life with this engaging map infographic designed specifically for showcasing information about Delaware. This template features a clean and modern layout, highlighted by vibrant blue bubble charts that effortlessly visualize key statistics. The combination of the state map and dynamic charts allows you to present complex data in a straightforward manner, making it perfect for business presentations, educational reports, or community planning discussions.
Ideal for professionals in marketing, education, or local government, this template helps you effectively communicate trends and insights. The intuitive design ensures that your audience can easily grasp the information, whether you’re discussing demographic changes, economic statistics, or project outcomes.
Don’t miss the chance to elevate your presentations—download this template today and transform your data into compelling visuals that resonate with your audience! Find more such Map PowerPoint templates for engaging presentations. These templates are compatible with both PowerPoint and Google Slides.


