Comparison PPT Template
Enhance your presentation, with this template tailored for conducting thorough cost benefit analysis presentations! This slide offers an transpar....
Company Comparison Chart PowerPoint Template Company Comparison Chart PowerPoint template helps you perform analyses between two companies in a s....
Show your audience an eye catching comparison chart that simplifies details in an appealing way to impress those involved in the project Stakehol....
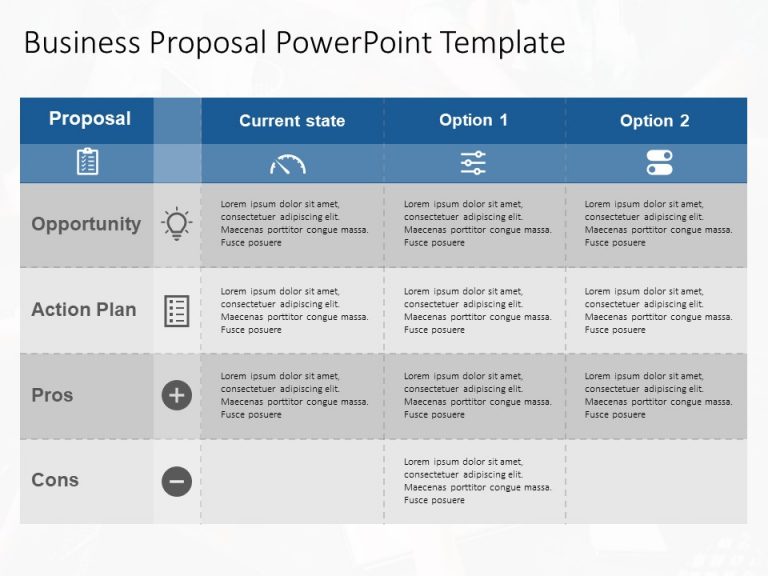
The Business Option PowerPoint Template is a well-defined tabular layout that helps present business proposals in a 4×4 format. The template....
The Marketing Proposal PowerPoint Template is designed for professionals who want to make an impression on others with their marketing strategies....
Harvey balls are circular shape diagrams that are mostly used for comparison in PowerPoint presentations. Harvey Balls Charts provides valuable i....
Share your ideas using this evaluation template crafted for assessing strengths and weaknesses effectively This striking slide showcases a distin....
Ideal, for team meetings or presentations is this template that simplifies the process of comparing products. Its sleek and contemporary design i....
For impactful presentations that stand out in your business meetings or strategic planning sessions use this numerical comparison table template ....
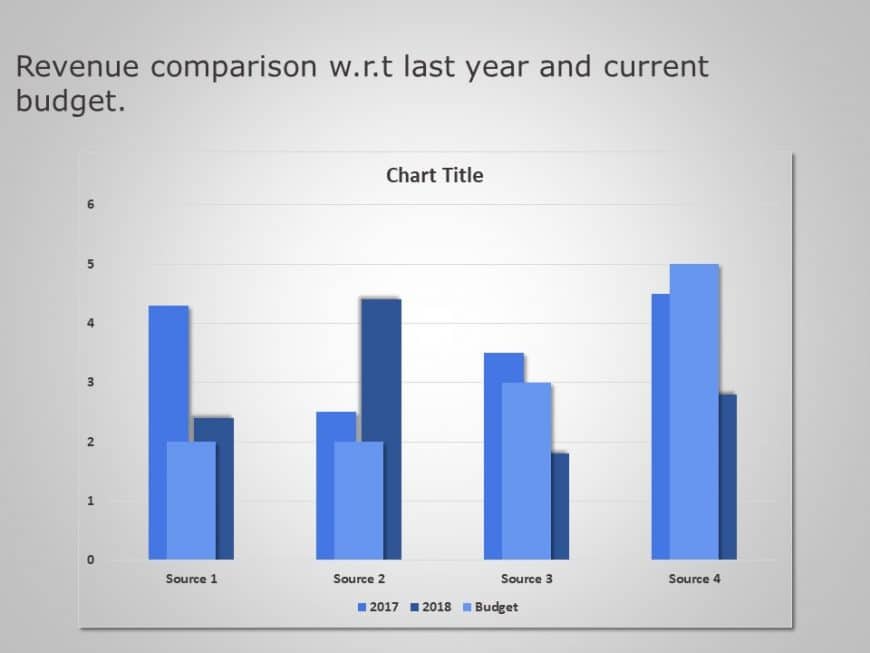
This grey and blue template helps showcase financial reports or performance reviews. This slide is professionally designed for finance profession....
Enhance your storytelling using this comparison chart tailored for brand positioning purposes that enables you to effectively display the charact....
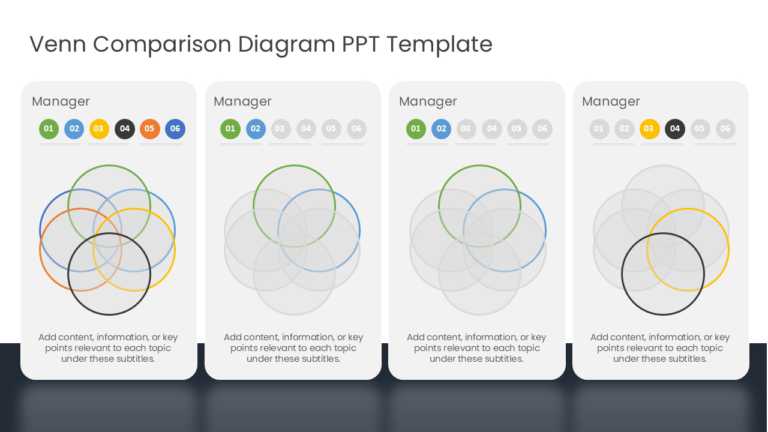
Enhance your presentation by using this Venn diagram template for comparisons and analyses tailored for managers and team leaders alike. The temp....
Related Presentations
Who Can Use These Comparison Slides?
1. Business and Strategy: You can use a comparison Powerpoint template to examine market opportunities, evaluate business structures and possible investments, analyze competition, and develop an overall strategy for decision-making.
2. Marketing and Branding: You can use this PPT template for comparison to measure the effectiveness of a campaign across different platforms while checking engagement and brand positioning to achieve optimal results.
3. Finance and Data Analysis: You can do a side-by-side comparison of expectation and budget versus actual performance results on top of financial forecasts and risk management strategies for financial performance management.
4. Education and Training: Professionals can conduct industry research and training effectiveness evaluations by assessing learning outcomes using various approaches.
Why Our Comparison PPT Templates Make Your Presentations Stand Out?
1. Drives Smarter Decisions: Utilize our comparison PowerPoint template in order to analyze and compare the effectiveness of the marketing strategies used across different platforms while tracking audience interaction to maximize impact
2. Enhances Clarity: These Google Slide templates are beneficial for investors and stakeholders in identifying opportunities and risks by getting a clear understanding of the situation.
3. Reduces Information Overload: These comparison templates simplify complex data into easy-to-understand insights for quick analysis and decision-making.
A well-structured comparison PowerPoint template helps professionals make informed decisions faster. By presenting information side by side, audiences can quickly grasp key differences and takeaways.
How to Create High-Impact Comparison Slides with Our Templates
1. Keep Alignment & Spacing Consistent: Enhance your professional appearance by utilizing our comparison templates that promote consistent spacing and organized layouts.
2. Highlight Key Differences: Use our business PowerPoint templates to highlight important differences, enabling quick comparisons and data-driven decision-making.
3. Use Real Data & Stats: Upgrade your presentations with accurate data by utilizing these comparison powerpoint templates to deliver compelling insights with clarity and impact.
4. Include Smooth Animations: Elevate your presentations by implementing impactful transitions and animations that command audience attention and enhance the flow of your content.


