
 Fall Sale
  Flat 10% off on our Unlimited Access Yearly Membership plan!


US Map Templates for PowerPoint

Easily turn your data into insights using this set of editable US maps that cater to professionals, across different industries. These templates ....


Craft engaging presentations using this eye catching map crafted to exhibit market share information throughout the United States ! This design s....

Uncover valuable insights, from your data using an timeline map specifically crafted for historical examination purposes! This design showcases a....

Enhance your influence using this map template crafted for displaying business locations throughout the United States effectively! The slide show....

Elevate your storytelling with this dynamic market share analysis template designed specifically for Alaska! Perfect for business professionals a....

Designed for clarity and impact, enhance your presentations with this Arizona Map infographic template. Perfect for showcasing geographic data, t....
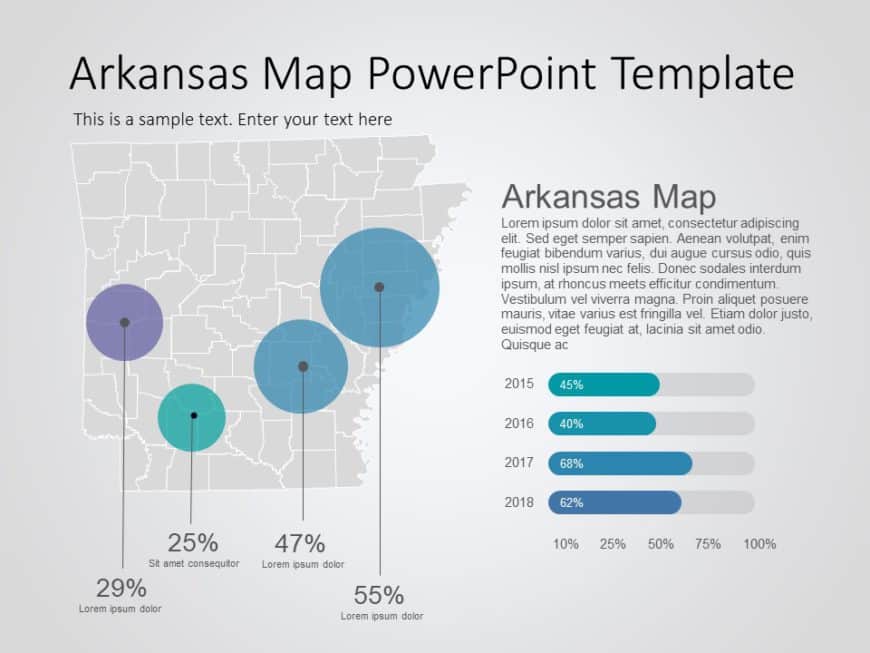
Capture your audience’s attention right from the start with this visually engaging Arkansas map template! Perfect for presentations that re....

Simplify information sharing with this visually engaging Colorado map template, designed to enhance your presentations with clarity and style. Fe....

Simplify information sharing with this engaging map template designed specifically for showcasing business locations across Connecticut. This vis....

Impress stakeholders with this engaging demographic map designed specifically for Georgia! This template offers a clear and visually appealing wa....
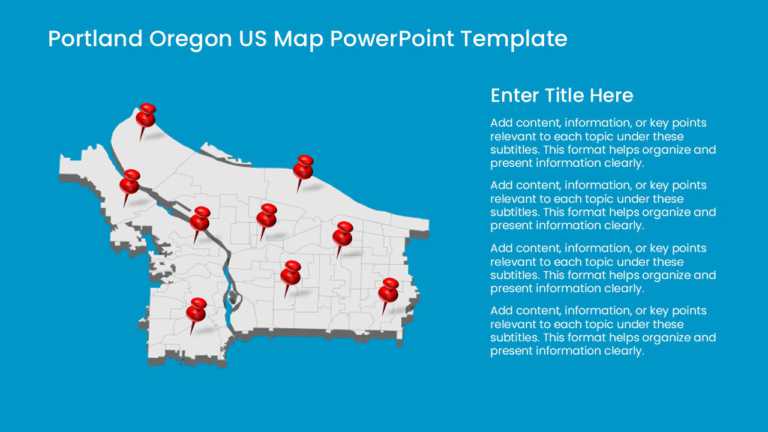
This template offers a visually engaging map of Portland Oregon, designed to enhance your presentations. With its clear layout and vibrant color ....
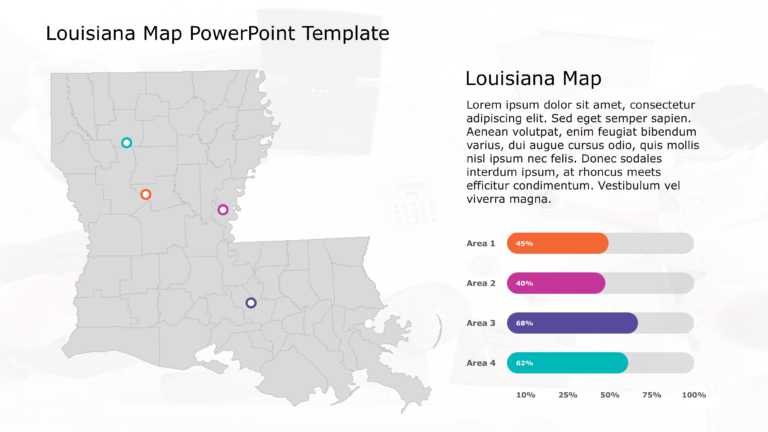
Simplify information sharing with this dynamic Louisiana map template! Perfect for professionals looking to present geographical data in a clear ....
Related Presentations
-

United Kingdom Maps
17 templates>
-
Brazil Map
9 templates>
-
Philippines Map
8 templates>
-
Maps
506 templates>
-
World Maps
29 templates>


What is a US map template for PowerPoint?
A US map template for PowerPoint is a slide in which all 50 states and Washington, DC are drawn as separate vector shapes rather than one image. You can recolor any state, group states into regions or sales territories, add labels, and resize the map without losing sharpness.
Which US map style do you need?
| Style | Use it for | Watch out for |
| Labeled state map | General audiences; anything where states are named aloud | Northeast states are too small for inline labels; use abbreviations with leader lines |
| Blank / outline US map | Quizzes, training, fill-in-live sessions | Add a legend if you color states; blank maps carry no context |
| Regional map (Northeast, Midwest, South, West) | Census-style regional splits, market overviews | Say which regional standard you’re using; Census regions, time zones, and sales regions all differ |
| Sales territory map | Rep coverage, franchise zones, service areas | Territories that split a state need county lines or a custom boundary; check the template supports it |
| US map with location pins | Office, store, or distribution footprint | More than ~30 pins at national scale collide; switch to state coloring |
| USA map with data callouts | KPIs per state or region alongside the map | Callouts beat on-map numbers when more than ~10 states carry values |
How do you highlight states or build regions on a US map slide?
- Click any state. It selects as its own shape.
- Hold Shift and click to add more states to the selection.
- Open Shape Format > Shape Fill and apply one color to the whole selection.
- To make a reusable territory, group it: select the states, right-click > Group. One click then selects the territory.
- For the small Northeast states (RI, CT, DE, NJ, MD), label with two-letter abbreviations and leader lines from Insert > Shapes rather than trying to fit full names inside the shapes.
How do you make a sales territory map of the US?
Assign each territory a color, Shift-click its states, and apply the fill in one step. Group each territory so it moves and recolors as a unit. Add a legend mapping colors to reps or regions, and put each territory’s number, accounts, quota, or coverage, in a callout beside the map rather than inside small states.
If a territory splits a state, draw the boundary yourself with Insert > Shapes > Freeform over the state map. These templates work at state level, so a mid-state line is a manual overlay, not a selectable shape.
Alaska and Hawaii: insets or to scale?
Use insets, boxed and bottom-left, the way audiences expect. A to-scale placement makes the map unusable on a slide: Alaska alone is about a fifth the size of the lower 48 and pushes everything else into a corner. The trade-off is that insets understate Alaska’s size, which only matters if area itself is your data. If you’re not mapping Alaska or Hawaii at all, say “contiguous US” on the slide and drop the insets. This is clearer than leaving them gray.
Looking for a single state?
Every state in these templates isolates in two clicks: click the state, copy it to a new slide, and scale it up. This creates a clean single-state map with the same editable shape, label, and fill. No separate template is needed for Texas, California, Florida, or any other state.
Looking for American flag backgrounds rather than maps? Explore our American flag PowerPoint backgrounds.
Do these US maps work in Google Slides?
Yes. Upload the .pptx to Google Drive and open it with Google Slides. States stay individually selectable and recolor through Fill color.
Can I show state abbreviations instead of full names?
Yes. Labels are text boxes separate from the state shapes. Swap any label’s text, or delete the label layer entirely for a blank map.
Can I edit a US map without PowerPoint?
Yes. Open any of these maps in Creatos AI and states remain selectable in the browser; export to .pptx when done.
Is Washington, DC included?
Yes. It is included as its own selectable shape, though at national scale you’ll want a leader-line callout to point to it.
Can I map data by state, like revenue or headcount?
Yes. Color states manually along a light-to-dark scale and add a legend, or use a data-callout template that pairs the map with KPI boxes.
Do you have maps of individual states?
Every state isolates from the national map in two clicks. See “Looking for a single state?” above.