


Understanding Fishbone Diagram: With Examples and Templates That Make Problem-Solving Easy
In the ever-changing world of problem-solving and process improvement, the Fishbone Diagram, also called the Ishikawa or Cause and Effect Diagram, is a simple and great tool. Originally, this diagram was created by Dr. Kaoru Ishikawa; it helps break down complex problems into smaller, understandable parts. Its fishbone-like structure visually organizes issues, making it easy to find the root causes, not just the symptoms. Used widely in many industries, it’s perfect for tackling problems like falling sales or project delays.
This blog will explain the Ishikawa Diagram, share real-world examples, and show how it can improve your problem-solving. Whether you’re a manager, marketer, or team leader, this tool will make analyzing issues easier. It helps team members focus on the main problems, saving time and leading to better solutions. Join us to learn how to use this tool for clear, impactful results.
What is a Fishbone Diagram?
The Fishbone diagram, also known as the Ishikawa diagram or the Cause and Effect diagram, is a powerful root cause analysis tool utilized across various industries. The Fishbone diagram is a visual representation that helps teams to analyze potential factors causing a problem systematically. It has a shape like the skeleton of a fish. It categorizes the causes into major branches according to the theme. This structured approach promotes collaboration and helps in thorough root cause investigation.
Here is how Fishbone analysis works:
Main Problem Statement: The “fish head” of the fish skeleton represents the potential cause of a problem you are trying to solve.
Major Categories: The “backbone” or “fish spine” of the fish skeleton is divided into major categories that impact the problem. The spine of the fish represents the main flow of the process, with smaller bones branching out. Common categories of fishbone analysis include:
- People: This includes human factors like skills, training, and motivation.
- Processes: This consists of workflows, procedures, and systems.
- Equipment: This includes tools, machinery, and technology.
- Materials: This shows raw materials, supplies, and components.
- Environment: This includes external environmental factors like weather, regulations, and competition.
Root Causes: The “bones” branch out from the major categories to represent specific potential causes within each problem category.
Below is a fishbone in PowerPoint example –
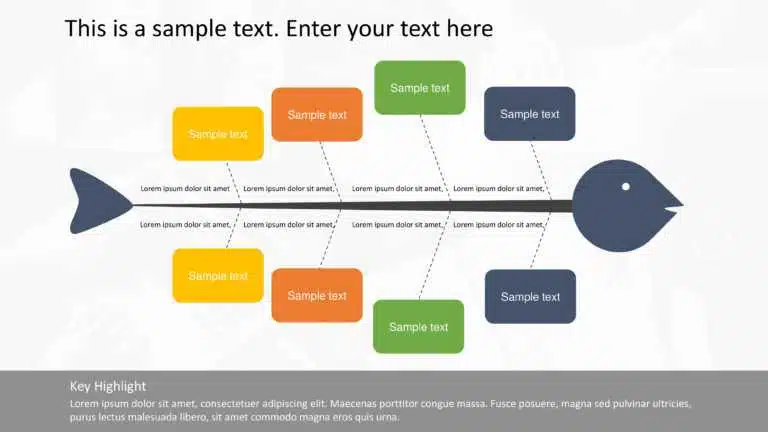
The Fishbone diagram templates resemble a fish skeleton. The problem is displayed at the front of the fish’s head, the major categories are shown on the backbone, and the possible causes are listed in the smaller bones. This PowerPoint fishbone diagram example shows the sales decline analysis of a product and its potential root causes.
What are the Uses of the Ishikawa Diagram?
- Root Cause Analysis: The Ishikawa diagram helps identify the root cause of the problem rather than just addressing its symptoms.
- Problem-solving: It helps break down complex problems into small, manageable parts, which makes it easier to find solutions.
- Quality Improvement: It is used in quality control processes to identify defects and helps maintain and improve product or service standards.
- Decision-Making Support: The Cause and Effect diagram provides a clear visual representation of causes and helps prioritize them based on their impact. This helps in better and more informed decision-making.
- Team Collaboration and Brainstorming: It encourages discussions and cross-functional teamwork by visually mapping out ideas and causes.
- Strategic Planning and Analysis: It helps to assess specific factors affecting the goals and guides the development of strategies to achieve the objectives.
How to Make a Fishbone Diagram in PowerPoint?
Here are the steps to make a fishbone diagram in PowerPoint-
- Identify the Problem: The first step in a cause and effect analysis is problem identification. It includes – describing the nature of the problem, the magnitude of the problem, the person involved, when and where it occurs, etc. On your Fishbone diagram in PowerPoint, this will appear at the head of the fish—clearly defining the problem lays the groundwork for effective problem-solving.
- Work on the Main Causes of the Problem: This stage involves identifying the root causes of the problem. Highlight as many potential causes as possible that can be a part of the problem.
- Identify the Sub-Causes Through the Main Causes: Every major problem involves sub-causes that contribute to the occurrence of the primary cause. This step involves identifying the possible additional causes related to the major problems identified in step 2.
- Analyze the Diagram: By this step, a diagram would be ready, containing all the possible and potential causes of the problem that you could think of. This diagram now needs to be reviewed as a whole. These problems need to be analyzed in detail. Depending on the problems’ priority and urgency, you can dive further into each problem to investigate it critically.
- Derive an Action Plan: After knowing the problem and its causes in detail, the final task is to derive an action plan. Outline the best approach to address the problem and come up with the most viable solution for it.
Fishbone Diagram Examples for Better Root Cause Analysis
PowerPoint fishbone diagrams help various departments identify root causes of problems by organizing them into clear, logical categories. Below are six fishbone diagram examples showing how different teams benefit from this tool:
Marketing
- Low campaign performance and poor results can be due to incorrect audience targeting, weak messaging, bad timing, or wrong channel selection.
- Poor lead conversion may result from ineffective landing pages, unclear value propositions, or misaligned content with audience intent.
- How Fishbone Helps: A simple fishbone diagram for PowerPoint helps uncover these marketing gaps systematically to improve campaign outcomes.
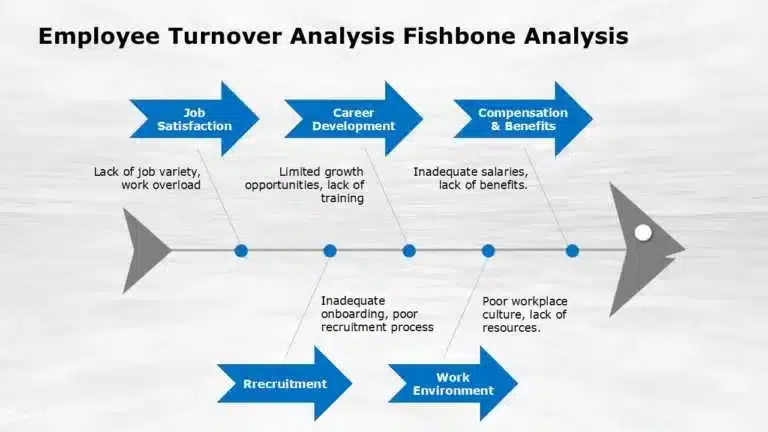
Human Resources
- High employee turnover is often caused by poor leadership, lack of career growth, low morale, or compensation issues.
- Low employee engagement could stem from unclear roles, a lack of recognition, or insufficient communication.
- How Fishbone Helps: Using a Fishbone Diagram in PowerPoint helps HR teams identify internal issues affecting retention and morale.
Sales
- Declining sales numbers might be related to pricing issues, unqualified leads, poor sales scripts, or market competition.
- Long sales cycle caused by a lack of urgency, weak follow-up, or unclear value propositions.
- How Fishbone Helps: A fishbone diagram for PowerPoint breaks down these issues to optimize the sales process.
Manufacturing
- Product quality issues could be due to equipment malfunction, poor materials, untrained staff, or a lack of manpower.
- Production delays may arise from bottlenecks, supply chain issues, or outdated processes.
- How Fishbone Helps: The Fishbone Diagram in PowerPoint identifies root causes to improve efficiency and reduce defects.
Customer Service
- Increased complaints may result from slow response times, rude behavior, or unresolved issues.
- Low customer satisfaction is often due to unclear policies, inconsistent service, or a lack of support tools.
- How Fishbone Helps: A Fishbone diagram for PowerPoint helps diagnose service flaws for better customer experiences.
IT/Tech
- Frequent system outages: Often linked to outdated infrastructure, overloaded servers, or poor monitoring.
- Slow software performance: It may stem from code inefficiencies, lack of updates, or integration problems.
- How Fishbone Helps: IT teams use Fishbone diagrams to troubleshoot and prevent recurring tech failures.
| Department | Example Problems | How Fishbone Diagram Helps |
| Marketing | Low campaign performance, Poor lead conversion | Identifies targeting, messaging, channel choice, landing pages, or timing issues. |
| Human Resources | High employee turnover, Low employee engagement | Analyzes poor leadership, lack of recognition, training gaps, or inadequate benefits. |
| Sales | Declining sales numbers, Long sales cycle | Breaks down pricing issues, ineffective pitches, weak follow-up, or unsuitable prospects. |
| Manufacturing | Product quality issues, Production delays | Highlights equipment faults, material quality, inefficient processes, or operator errors. |
| Customer Service | Increased complaints, Low customer satisfaction | Maps out various causes like slow responses, unclear policies, poor product knowledge, or tone issues. |
| IT/Tech | Frequent system outages, Slow software performance | Pinpoints root causes like outdated infrastructure, coding errors, poor scaling, or lack of QA. |
The above Fishbone diagram examples show how you can identify the root causes and effects of any specific problem and its versatility across various industries. You can use professional Ishikawa Fishbone diagram template designs to make your presentation impactful and impressive. If you want your presentation customized and designed by experts, drop your file on our professional presentation services and add your requirements in the comment section. We will provide you with a tailor-made presentation in just one day.
FAQs
-
What are the main categories typically used in a fishbone diagram?
A fishbone diagram, also known as an Ishikawa or cause-and-effect diagram, is used for identifying the root causes of a problem. The main categories typically used in a fishbone diagram include:
- People: Factors related to human resources and roles.
- Processes: Steps in the workflow that may contribute to issues.
- Materials: Raw materials or components involved in the process.
- Equipment: Tools, machines, or technology that are utilized.
- Environment: External conditions influencing performance (like location or climate change).
- Management: Organizational policies, quality management, and leadership factors.
By categorizing potential causes into these areas, teams can more effectively analyze problems and develop solutions!
-
How do you use a fishbone diagram?
A fishbone diagram is a visual tool used to identify and analyze the root causes of a problem. Here’s how to use it effectively:
- Identify the Problem: Start by clearly defining the problem you want to solve and write it at the head of the fishbone.
- Draw the Backbone: Create a horizontal line (the backbone) leading to the head. This will represent the main problem.
- Add Major Categories: Draw branches off the backbone for major categories of potential causes. Common categories include People, Processes, Materials, Environment, and Equipment.
- Brainstorm Causes: During the brainstorming session, identify potential causes for each category and add them as smaller branches extending from their respective sections.
- Analyze Causes: Review all identified causes and discuss with your team which ones are most likely contributing to the problem.
- Prioritize: Focus on addressing the most critical root causes that you believe will have the greatest impact on resolving the issue.
- Action Plan: Develop an action plan based on your analysis to address these root causes and monitor progress.
Using a fishbone diagram can help teams collaboratively dissect complex problems and promote structured thinking!
-
What are the benefits of cause and effect diagrams?
Cause and effect diagrams offer several benefits, including:
- Visual Representation: They provide a clear visual representation of potential causes of a problem, making it easier to identify relationships and patterns.
- Structured Thinking: These diagrams encourage structured thinking and brainstorming, helping teams organize their thoughts systematically.
- Collaboration: They facilitate collaboration among team members by allowing everyone to contribute ideas and insights in a shared format.
- Root Cause Analysis: Cause and effect diagrams are effective for root cause analysis, enabling teams to dig deeper into issues rather than just addressing symptoms.
- Problem-Solving: By clearly outlining possible causes, they help teams focus on the most likely factors contributing to a problem, leading to more targeted solutions.
- Improved Communication: The visual nature of these diagrams aids in communication, making it easier to explain complex problems to stakeholders.
Overall, cause and effect diagrams are valuable tools for enhancing understanding, fostering teamwork, and driving effective problem-solving processes.
-
What are some common mistakes to avoid when creating a fishbone diagram PowerPoint template?
Creating a fishbone template can be a valuable tool for identifying root causes of problems. However, there are some common mistakes to avoid:
- Lack of Focus: Failing to clearly define the problem can lead to confusion and irrelevant causes being included in the analysis.
- Overcomplicating the template: Including too many branches or details can make it cluttered and difficult to understand. Stick to major categories and key causes.
- Not Involving the Right People: Excluding team members who have relevant knowledge can limit the effectiveness. Collaboration is key!
- Neglecting Data Collection: Jumping straight into brainstorming without gathering data or evidence can result in assumptions rather than informed conclusions.
- Ignoring Follow-Up Action: Creating the template is just the first step; failing to take action based on identified causes can render the exercise useless.
By avoiding these pitfalls, you’ll create a more effective fishbone diagram that effectively helps uncover the underlying issues!
-
How can team collaboration enhance the effectiveness of a fishbone diagram?
Team collaboration can significantly enhance the effectiveness of a fishbone diagram in several ways:
- Diverse Perspectives: Bringing together team members from different backgrounds and departments allows for a variety of viewpoints on potential causes of a problem, leading to a more comprehensive analysis.
- Increased Engagement: Involving the whole team fosters ownership and accountability for the issues being addressed, which can motivate everyone to contribute ideas and solutions.
- Improved Problem-Solving: Collaboration encourages brainstorming, which can uncover root causes that might not have been considered by an individual working alone.
- Clear Communication: Working together on a cause-and-effect diagram promotes open dialogue among team members, helping ensure that everyone understands the problem and the factors contributing to it.
- Enhanced Creativity: Group dynamics can spark creativity, leading to innovative solutions that may not emerge in solitary thinking.
When teams collaborate effectively while creating a fishbone diagram, they create a more robust framework for identifying problems and implementing effective solutions.
Table Of Content


Related posts from the same category

4 Mar, 2024 | SlideUpLift
What Are The Five Whys? 5 Whys Root Cause Analysis Explained!
Have you ever encountered never-ending problems in your professional or personal lives? In their problem-solving and continuous improvement journey, organizations find challenges that require intensive research to reach their root

20 May, 2022 | SlideUpLift
Must Have Tools For Problem Solving In Business
According to certain research, the typical business professional spends 3 hours every week handling work-related problems! Isn’t it quite a lot? Problem solving is crucial to operating a company, and

17 Apr, 2025 | SlideUpLift
Personal SWOT Analysis: A Comprehensive Guide With Examples and Templates
Key Highlights A personal SWOT analysis is a great way to understand yourself better and grow. It helps you identify your strengths, weaknesses, opportunities, and threats. This tool gives you

4 May, 2022 | SlideUpLift
What Is A Key To Problem Solving? CATWOE Analysis Has The Answers
What lies at the core of addressing thorny business issues? We believe it is problem-solving. The most common and difficult obstacle to resolving problems using first principles is defining the

6 Mar, 2024 | SlideUpLift
Best Work Plan Templates For Easy Task Organization [With Examples]
A project's success depends on having a detailed task plan. How can you perform tasks without having a plan for them? You and your team can produce the ideal work

5 Mar, 2024 | SlideUpLift
SWOT Analysis Examples With Templates [Detailed List]
Developing a thorough business or product strategy takes time, but doing so is essential to creating a winning team vision. Planning how to transform your product ideas into workable solutions

20 Feb, 2024 | SlideUpLift
Detailed Guide For Start Stop Continue Retrospective [With Examples & Exercises]
A lot of people find it challenging to provide and accept constructive criticism. Why? Because receiving criticism can be awkward. It might be uncomfortable to criticize your team's performance, and

28 May, 2025 | SlideUpLift
Beginner’s Guide: How To Make A Venn Diagram In Powerpoint
What Is A Venn Diagram? In today’s fast-paced business world, clarity is currency, and Venn diagrams deliver just that. Whether you're analyzing market segments, comparing competitors, or aligning team strategies,

5 Mar, 2026 | SlideUpLift
Quarterly Business Review (QBR): What It Is, Examples & How to Present One
A QBR, or quarterly business review, is a strategic meeting held every three months to evaluate business performance, review key metrics, and align on goals for the next quarter. QBRs

22 Nov, 2024 | SlideUpLift
Personal Timeline Examples: 15+ Ideas to Map Your Life Story
Quick Answer A personal timeline is a visual map of the key moments in your life — births, milestones, achievements, and turning points — arranged in chronological order. People use