 Fall Sale
 Flat 40% off on our Unlimited Access Yearly Membership plan!

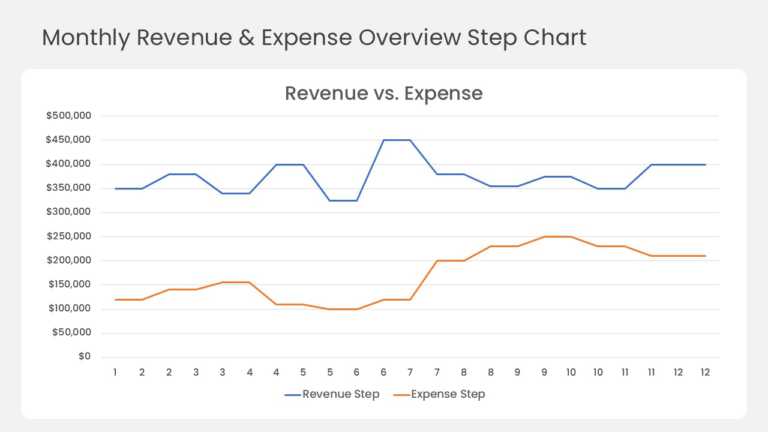
This step line chart compares monthly revenue and expenses across a full 12-month year. A blue revenue line and an orange expense line run across....


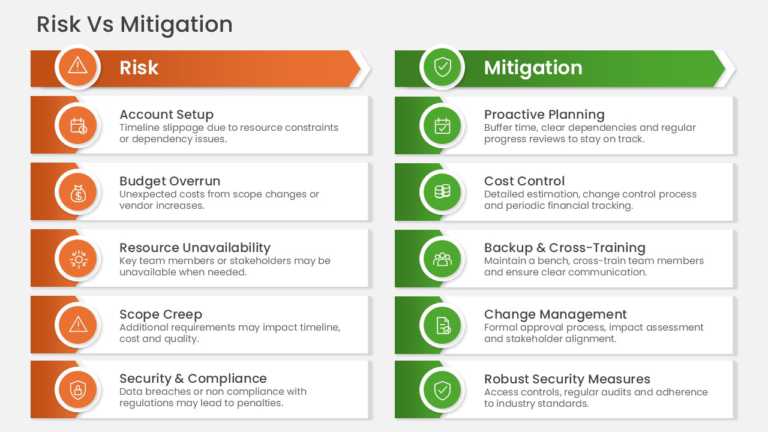
Two columns pair five project risks with their mitigation actions in a side-by-side comparison table. Rows address schedule slippage, budget over....
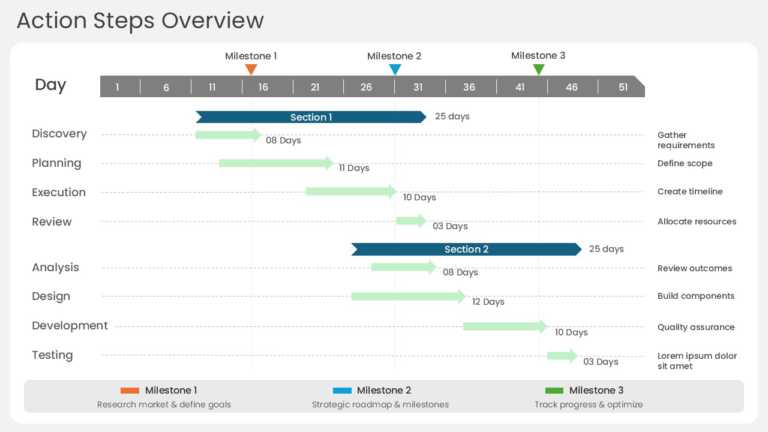
Horizontal task bars plot a project action plan across four sequential phases: discovery, planning, execution, and review. Each bar spans its sch....
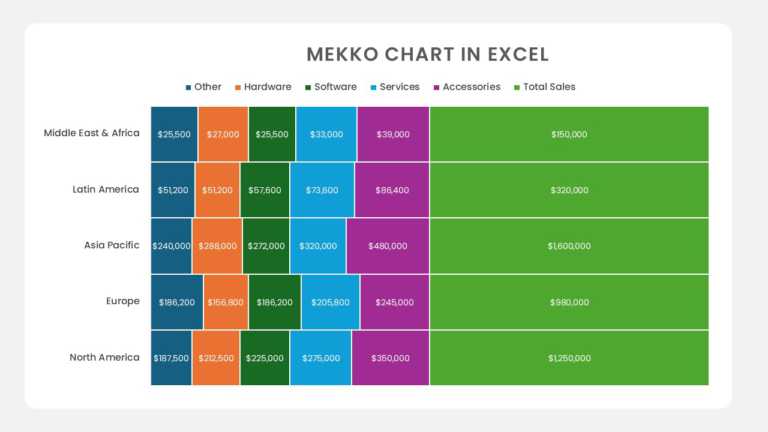
The Regional Product Sales Mekko Chart PowerPoint And Google Slides Template helps users compare product sales across multiple regions and unders....
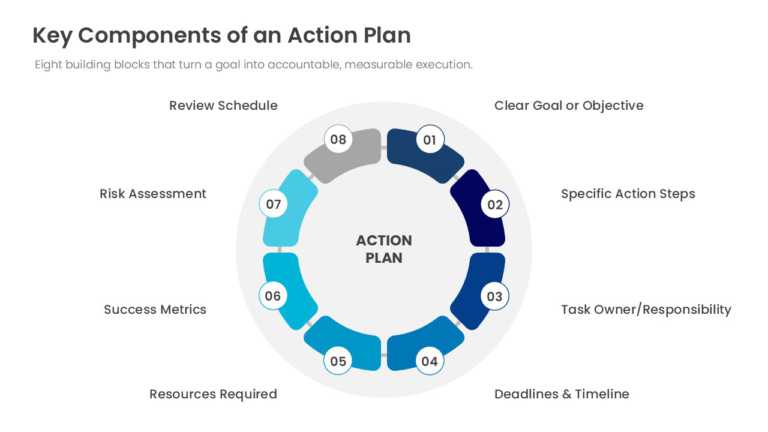
The Action Plan Process Framework PowerPoint And Google Slides Template helps users present the building blocks of an action plan across eight se....
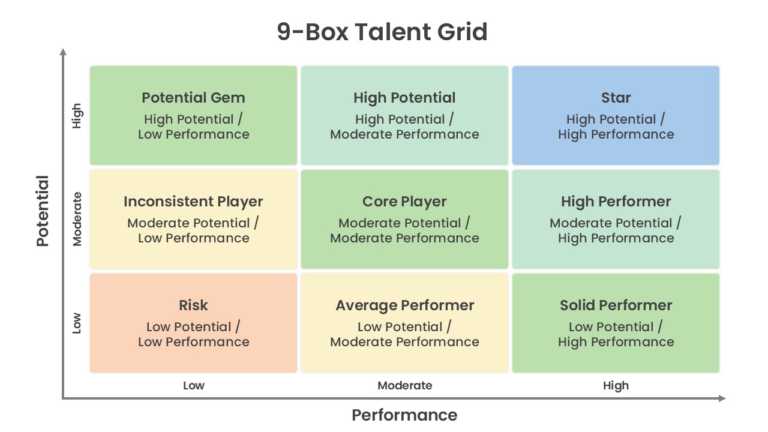
The 9-Box Talent Assessment Matrix PowerPoint And Google Slides Template helps users map employee talent across nine performance and potential ca....