![]() Spring Sale
Spring Sale ![]() Flat 10% off on our Unlimited Access Yearly Membership plan!
Flat 10% off on our Unlimited Access Yearly Membership plan!


This free Key Takeaways Template is crafted to highlight the most crucial points of a presentation. The infographics in the template emphasize th....
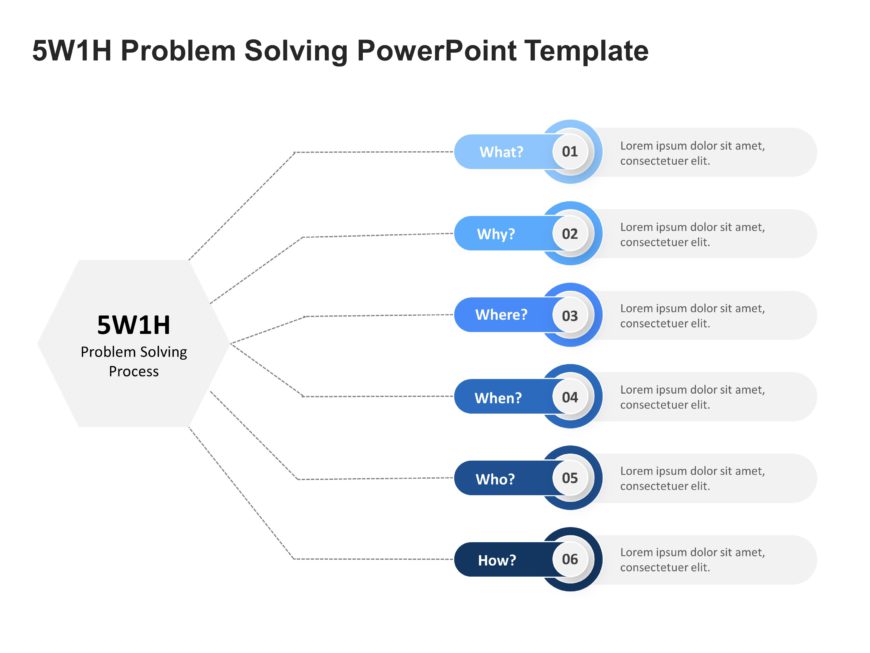
Express your ideas using this problem solving format crafted to enhance your decision making capabilities efficiently. With a sleek and contempor....

This template is perfect, for telling a story about cloud computing in an appealing way! It showcases the shift from cloud computing to cutting e....

Attract your audiences interest, from the beginning using this aid showcasing the lifecycle of the real estate market.This tool is tailored for r....

Elevate your data into insights using this crafted sales funnel template! Ideal, for marketing experts and corporate planners alike; this templat....

Enhance your meetings with this template, for managing supply chains on a whole new level! Crafted to simplify your presentations organization pr....

Elevate your storytelling with this dynamic SWOT analysis template! Designed to simplify strategic planning, this visually appealing layout helps....

Crafted to bring clarity and make a strong impression, on your audiences minds is this template that enriches your presentations by offering a pe....

Express your gift concepts using this captivating template crafted for crafting gift vouchers with a personal touch. Ideal, for enterprises and e....

Enhance your narrative with this framework crafted to simplify your planning procedure effectively! This model provides a defined and organized s....

Check out this eye catching funnel design that makes it easy to explain processes! With its rings and vibrant layout this template is great, for ....

Great, for team meetings and discussions alike is this template that aims to simplify your impact mapping procedures. Presenting an contemporary ....
Related Presentations
-

Morphing
7 templates>
-
Silhouette
78 templates>
-
Images
156 templates>
-
Poster
53 templates>