Product Description:
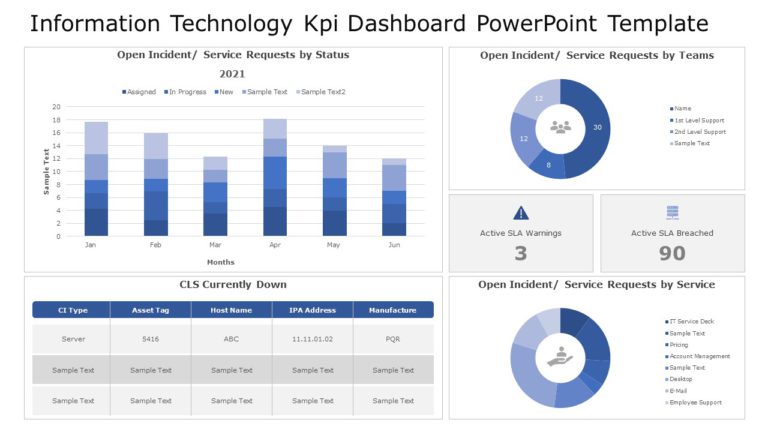
Elevate your presentations with this all template, for tracking and measuring the performance of your Information Technology (IT) operations effectively and clearly! Packed with eye catching visuals, like gauges. Trend analyses to help communicate metrics in a compelling way.
The template features gauges with colors that give quick insights into the impact, on services and performance in billing systems and HR systems as well, as help desk operations. The trend analysis graphs help you keep track of problem summaries and time passed so you can easily spot issues away.
Perfect for IT managers and their teams alike! This template is crafted to spark conversations, about strategy and evaluations of performance reviews effectively structured to keep everyone engaged and up, to date with breakdowns of service categories and payment patterns.
Enhance your IT presentations by downloading to convert your data into visuals! Find more such Dashboard PowerPoint templates for engaging presentations. These templates are compatible with both PowerPoint and Google Slides.


