![]() Spring Sale
Spring Sale ![]() Flat 10% off on our Unlimited Access Yearly Membership plan!
Flat 10% off on our Unlimited Access Yearly Membership plan!

Dashboard PPT Templates & Slides

The Dashboard PowerPoint Template is designed to present multiple intelligences assessment results and learning profiles using a structured dashb....
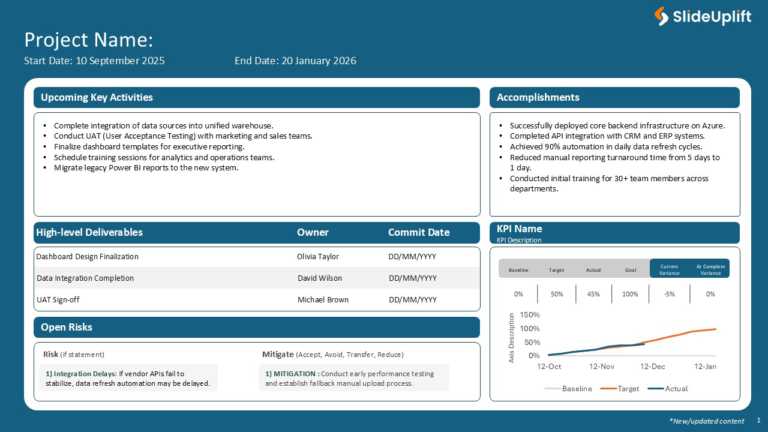
Maximize your impact with this comprehensive project overview template designed to keep your team aligned and informed. This visually appealing l....

Trim the clutter from your presentation with this business‑performance dashboard template. Tailored to hand you an overview of your sales metrics....
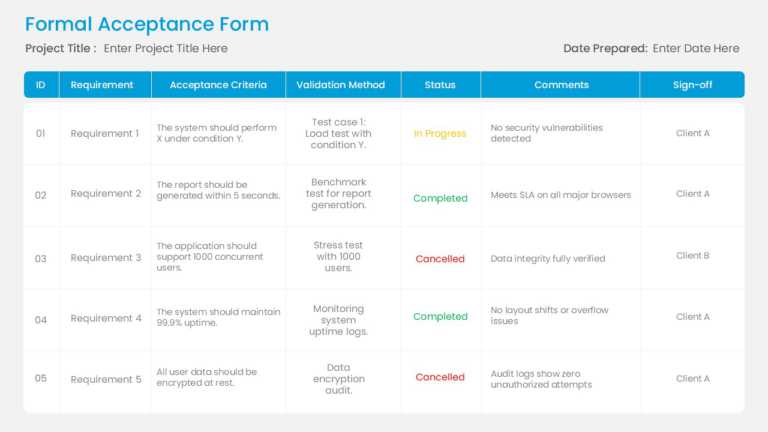
Make information sharing easier with this form template made for project needs and requirements. This easy-to-use format enables teams to clearly....
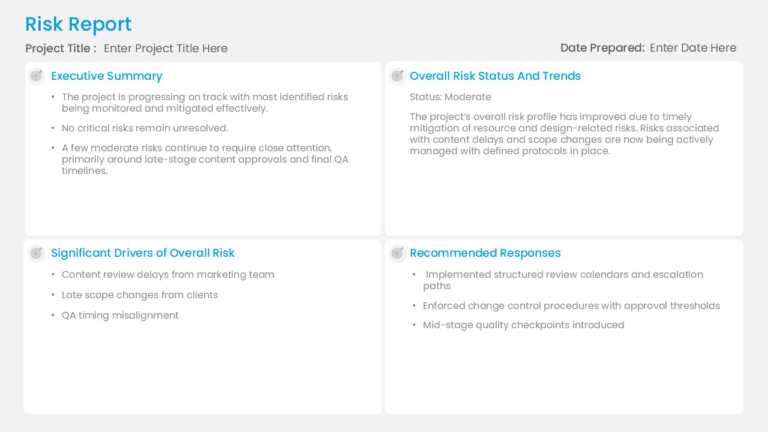
Enhance the impact of your presentation using this risk assessment dashboard template that is tailored to aid project managers and corporate team....
Create a storyline using this encompassing dashboard, specifically made for project management oversight purposes. This tool streamlines the intr....
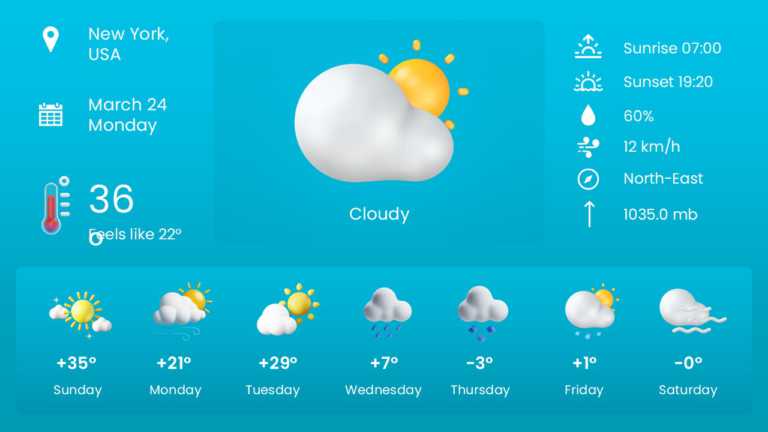
Enhance your storytelling using this animated template for presenting an overview of the week’s weather conditions in just seven days! Idea....
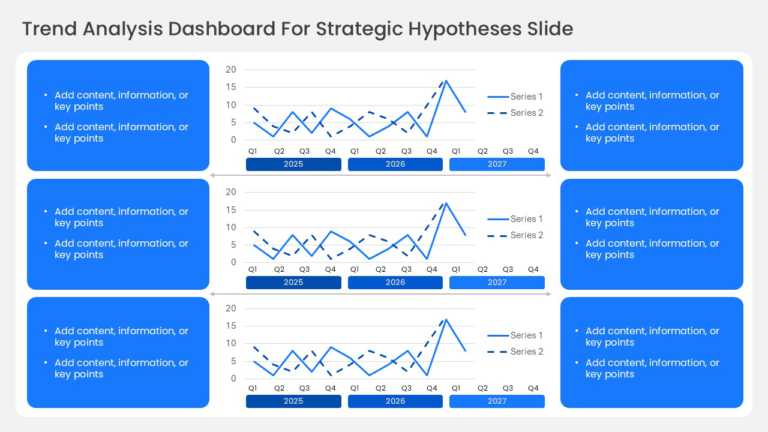
Simplify concepts using this all encompassing dashboard created for analyzing trends and developing theories effectively. This layout offers a us....
This modern dashboard PowerPoint template is perfect for business professionals to summarise their business highlights. This slide can be used in....

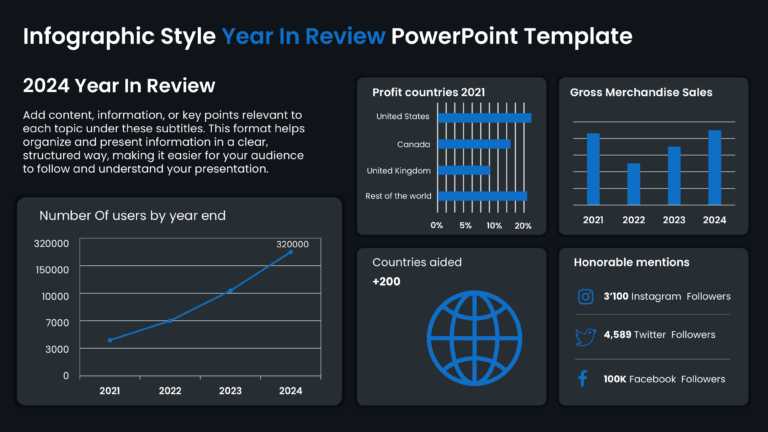
This modern year-in-review template is ideal for professionals who want to present any seven key performance metrics related to their business su....

This modern and sleek template is ideally suited for CEOs or business executives. It’s designed to help them quickly understand the company....

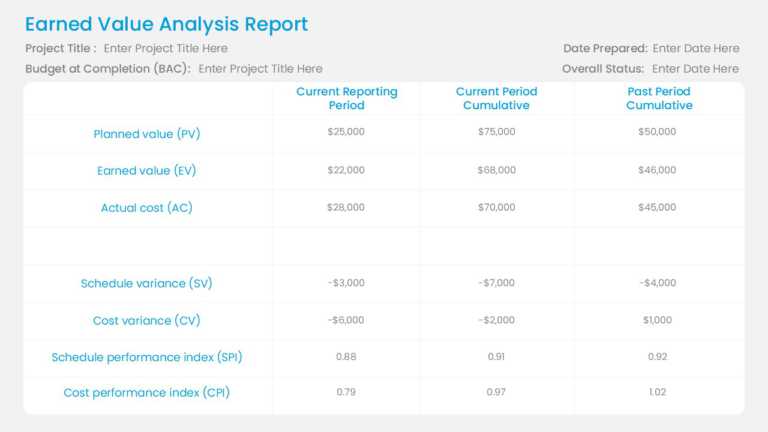
The Financial Summary Template is a visual-heavy and organized presentation template that can be used for budget-related aspects of a project or ....
Related Presentations
-

KPI
169 templates>
-
QBR
110 templates>
-
Deadline
6 templates>
-
Business
6,460 templates>
-
SWOT Analysis
131 templates>
Elevate Data Visualization with Professional Dashboard PowerPoint Templates
- SlideUpLift’s professional PowerPoint presentation templates simplify data in a way that is easier for the audience to comprehend. Rather than overwhelming the audience with complex and huge information, our templates help break down and present the information in brief visuals. Dashboard templates assist professionals in identifying different trends in businesses to make the right decisions. They provide a structured format that arranges data in a logical and visually pleasing manner. You can transform your heavily loaded slides into meaningful insights with the help of our dashboard slide template. SlideUpLift’s templates can be useful for professionals from all industries, such as marketing, finance, and project management.
- Our templates are fully editable which allows professionals to customize and build a presentation that as per their business requirements. These templates can be utilized for anything, from tracking sales to analyzing financial performance or monitoring project progress. With a dashboard PowerPoint template, data becomes easy to modify and always up to date. Aside from the paid ones, you can download free dashboard PPT template to easily develop meaningful presentations.
Why Do Professionals Rely on Dashboard Templates?
- Professionals deal with enormous amounts of information that is difficult to interpret using only text. SlideUpLift’s dashboard templates represent data in an easy-to-understand manner, thus making its interpretation effortless. PowerPoint dashboard templates are designed to provide a clear framework that lets professionals present their analysis efficiently. Through our dashboard templates, professionals from various teams can align their strategies and goals in one direction.
- Individuals in various fields use dashboard templates because they are time-saving and more precise than regular ones. Instead of compiling their reports independently, professionals can download free PPT templates and merge them effortlessly. Templates minimize the chances of making mistakes and guarantee that your content is credible. When data is presented in a more attractive and simpler manner, employees are in a better position to make the right decisions at the right time.
How to Use Dashboard Templates Effectively?
- Focus on Key Metrics: When using a dashboard PPT template, you should only concentrate on the key metrics. Do not use the dashboard to present unnecessary information. Only focus on the data that can help you make better business decisions and, thus, achieve defined goals. This way, getting your message across to the audience with a simple and uncluttered dashboard is easier.
- Use Colors Wisely: The sensible use of colors makes your content stand out and enhances data visualization. Using color tones that contrast well with each other is a good practice, so use a consistent color theme. Avoid using too many colors, as they may distract the audience from the core message of your presentation.
- Choose the Right Charts: The correct visuals help in a better illustration of the collected data. You should use a bar graph for comparisons, a line graph for trends, and a pie chart to distinguish different elements. Do not use complicated infographics that leave the audience confused. There are various types of charts available in a free dashboard PowerPoint template that you can use to present your data accordingly.
- Keep Data Clear, Simple, and Easy to Read: Do not overcrowd the dashboard with excessive text or data attributes. Using bullet points, labels, and spacing enhances the readability of the information. Your font size should be large enough for the audience to read, and the layout should provide a clean look to your presentation. Sort the data using a dashboard PPT template and present it in a clear and organized manner.