Product Description:
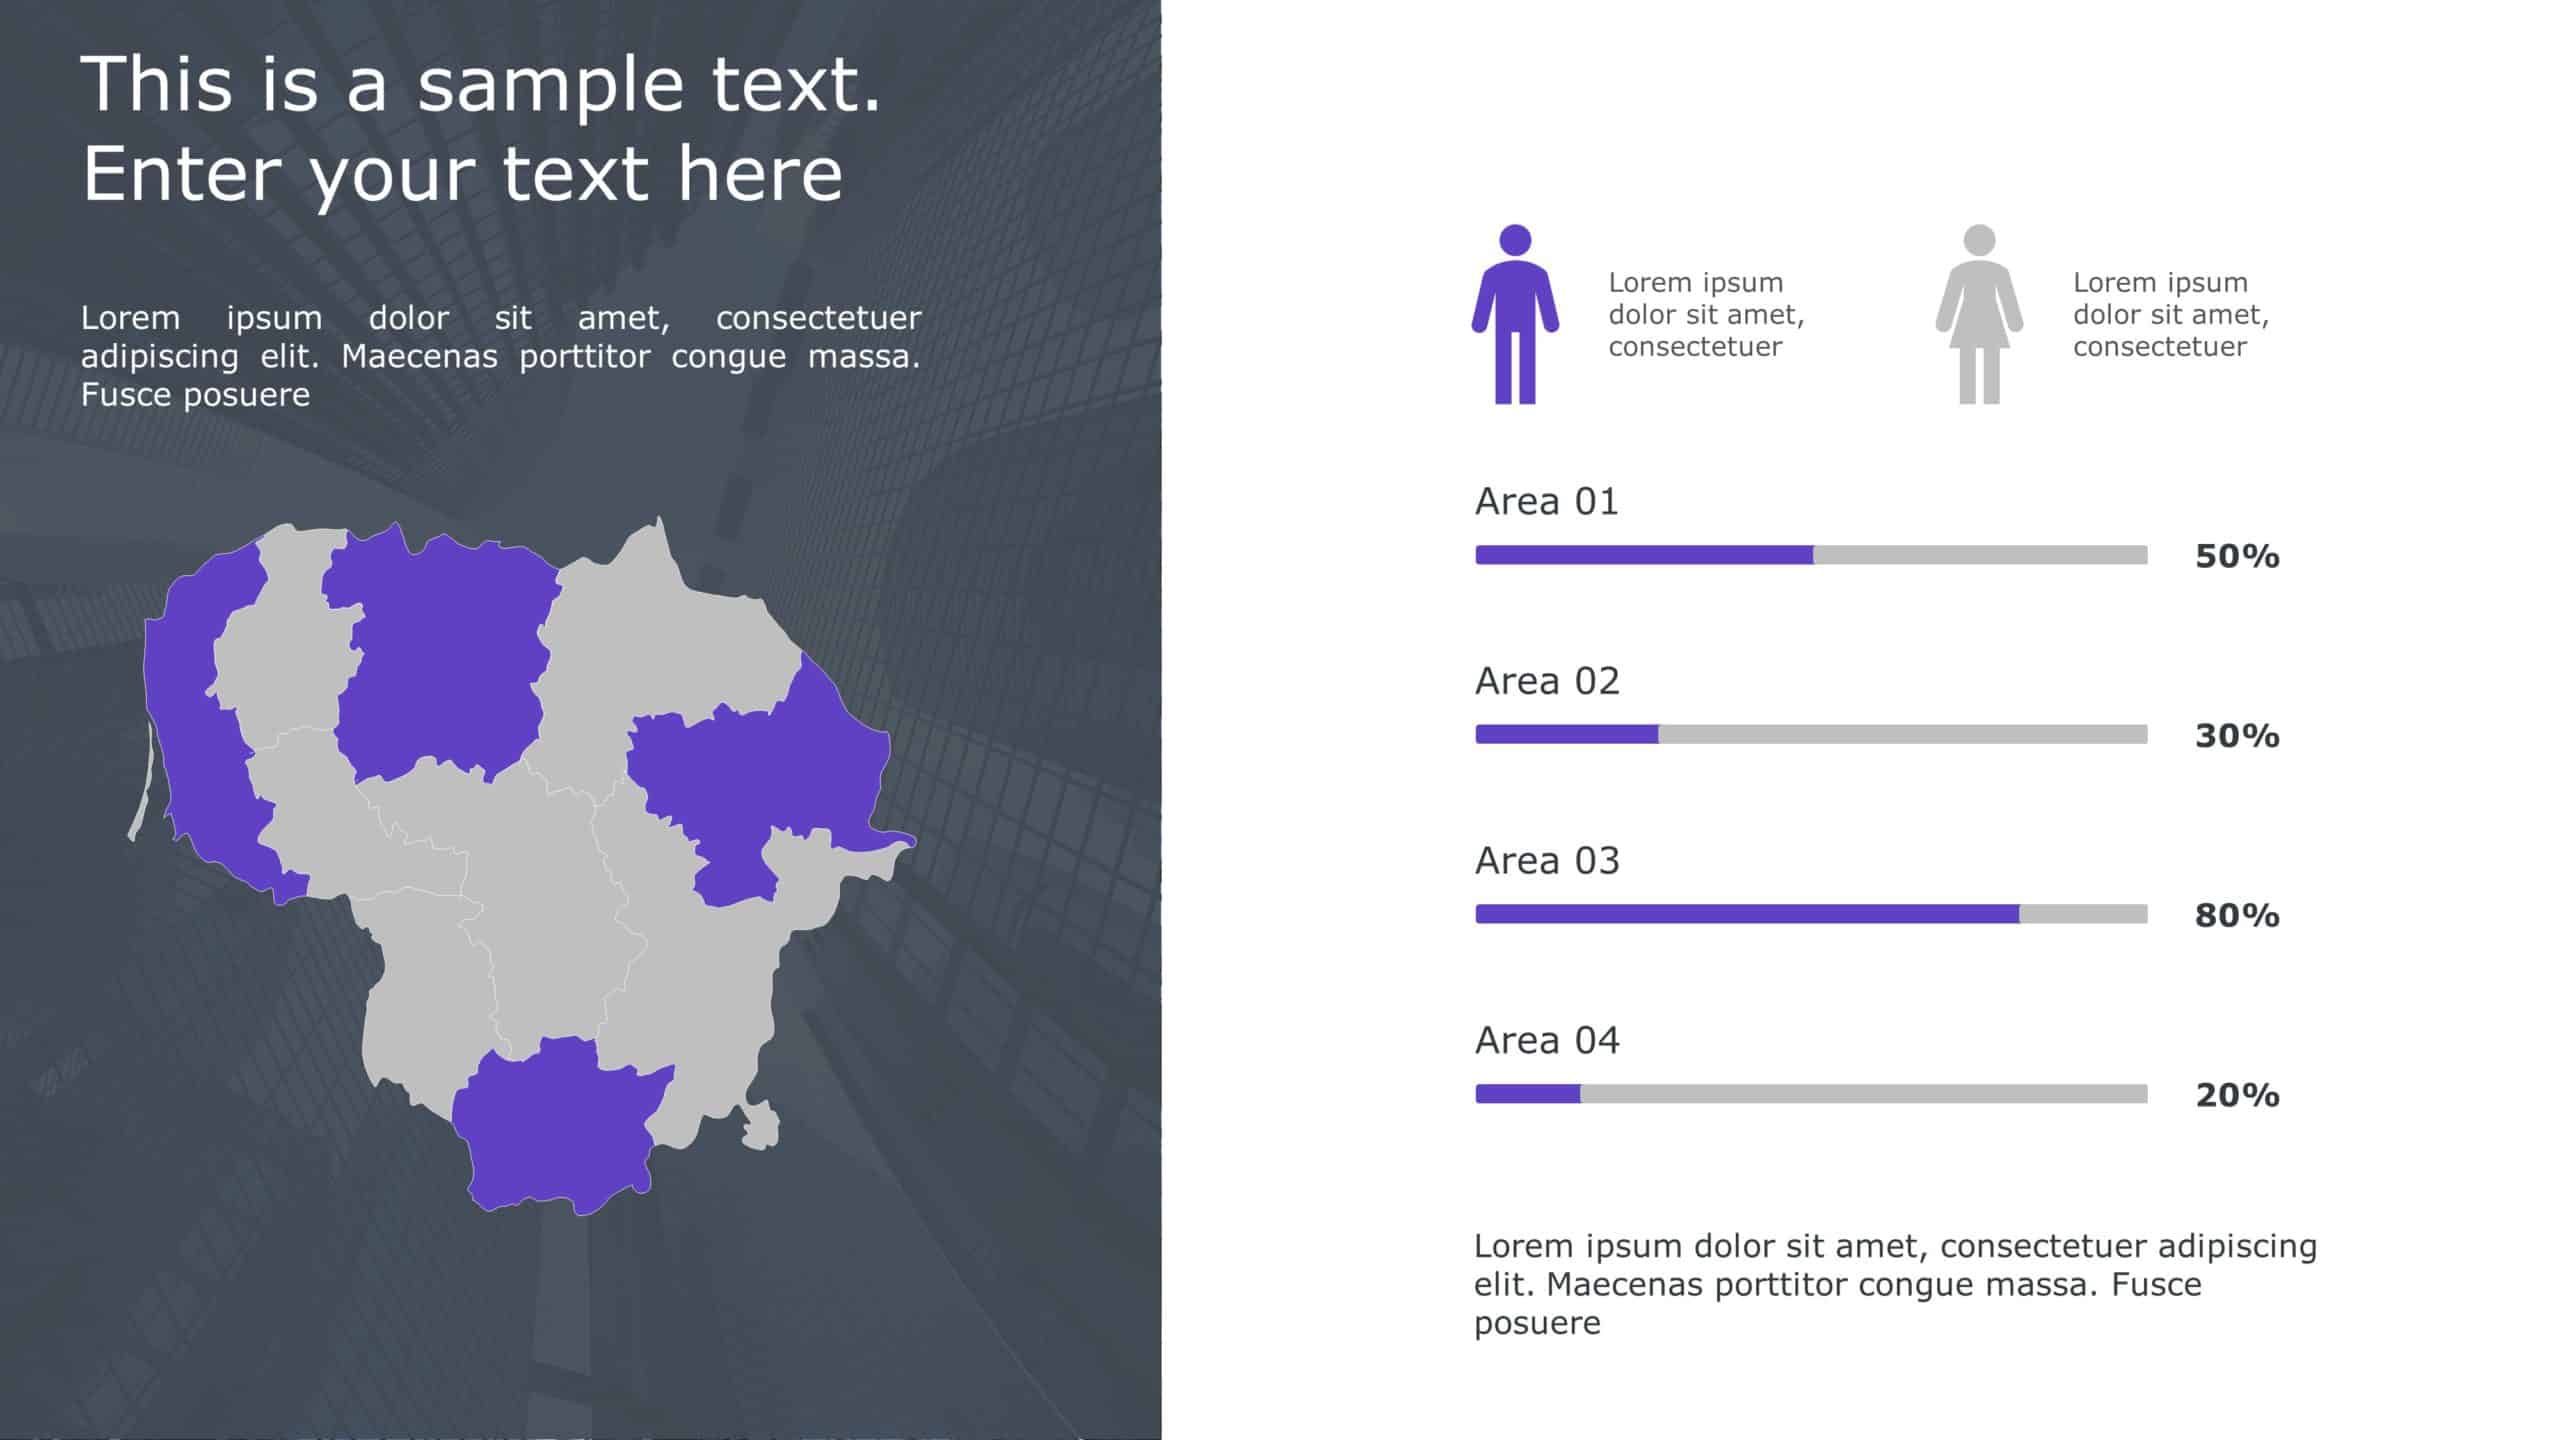
Capture your audience’s attention right from the start with this visually striking regional map infographic. Designed to effectively showcase demographic data, this template features a bold purple and gray color scheme that enhances clarity and engagement. The left side displays a detailed map, highlighting specific areas in vibrant purple, making it perfect for presentations focused on regional analysis or market segmentation.
On the right, the demographic bars provide a clear visual representation of data across different areas, making it easy for your audience to grasp key statistics at a glance. This layout is ideal for corporate professionals, marketers, or educators looking to present complex information in a digestible format.
Whether you’re discussing market trends, population statistics, or project progress, this template ensures your message is communicated effectively. Download now and transform your presentations into impactful visual stories! Find more such Map PowerPoint templates for engaging presentations. These templates are compatible with both PowerPoint and Google Slides.


