Product Description:
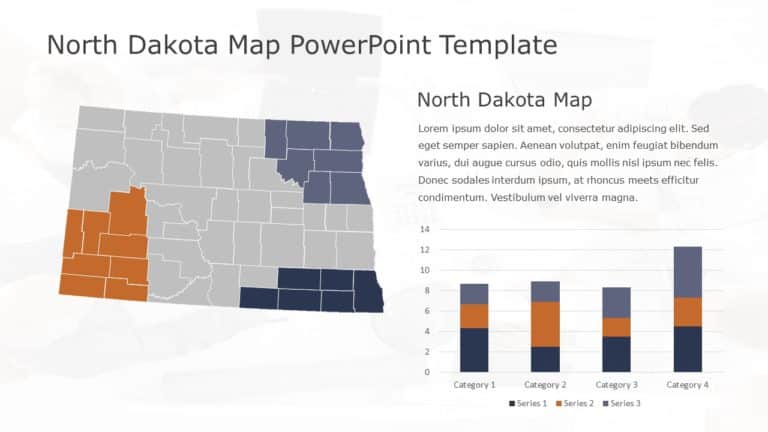
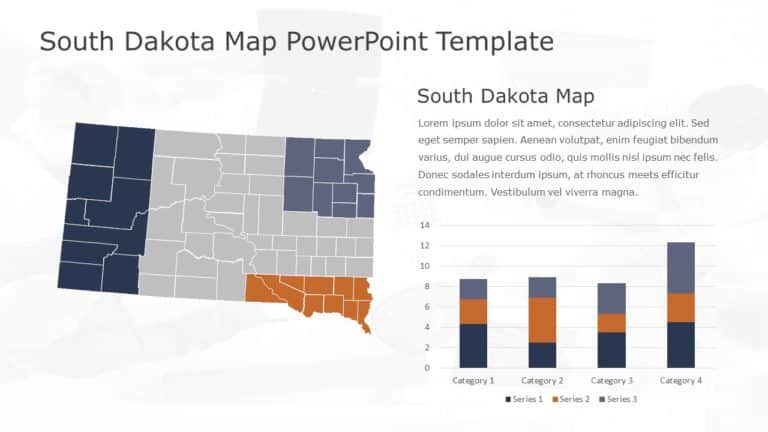
Impress stakeholders with this visually captivating infographic that combines a detailed map of Hawaii with a dynamic bar chart. This template is perfect for presentations that require geographical insights alongside data analysis. The vibrant orange and blue color scheme not only enhances visual appeal but also ensures clarity in presenting complex information.
Designed for professionals in marketing, education, and project management, this slide is ideal for showcasing regional data trends or performance metrics. The map allows you to highlight specific areas of interest, while the bar chart effectively communicates comparisons across different categories.
Whether you’re discussing market opportunities, educational statistics, or project outcomes, this template provides a structured layout that makes your points easy to grasp. Don’t miss the chance to elevate your presentations—download this template today and bring your data to life! Find more such Map PowerPoint templates for engaging presentations. These templates are compatible with both PowerPoint and Google Slides.


