Product Description:
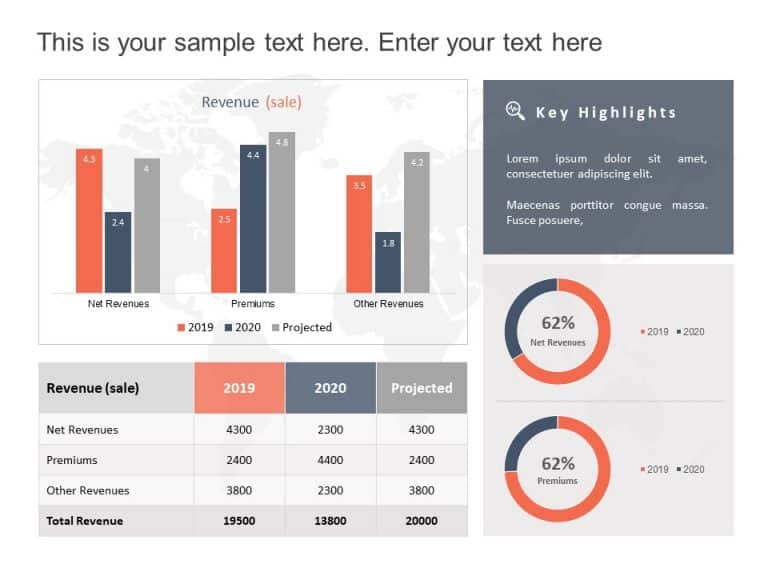
Break down concepts using this appealing pie chart template crafted for analyzing performance metrics effectively.This presentation slide enables you to convey data in a manner. Is perfect, for periodic assessments or project reviews.The use of colors to differentiate each section allows you to emphasize performance metrics and trends effortlessly.
The design includes a representation that not only grabs attention but also improves comprehension—an ideal choice, for business experts and team managers seeking to present outcomes concisely and effectively communicate the complete picture of their data through detailed insights, in each quarter section.
Whether you work in finance or marketing or project management fields this template is designed to suit your requirements perfectly Grab it now. Elevate your presentations into storytelling assets that influence decision making Find more such Graphs & Charts PowerPoint templates for engaging presentations. These templates are compatible with both PowerPoint and Google Slides.


