Comparison Slides For Presentations

Explaining the differences between two items during a presentation can be challenging if you are not using a proper comparison slide. A comparison slide helps you break down detailed data into bite-sized points and helps your audience understand the differences.
Read more

Business Comparison Line Chart Presentation Template Use this Business Comparison Line Chart PowerPoint template to create visually appealing pre....

2 Steps Presentation Template Use this 2 Steps PowerPoint template to create visually appealing presentations in any professional setting. Its mi....

Competitor Analysis Presentation Template Use this Competitor Analysis PowerPoint template to create visually appealing presentations in any prof....

Multiple Line Graphs Presentation Template Use this Multiple Line Graphs PowerPoint template to create visually appealing presentations in any pr....

Problem Statement 5 Presentation Template Use this Problem Statement 5 PowerPoint template to create visually appealing presentations in any prof....

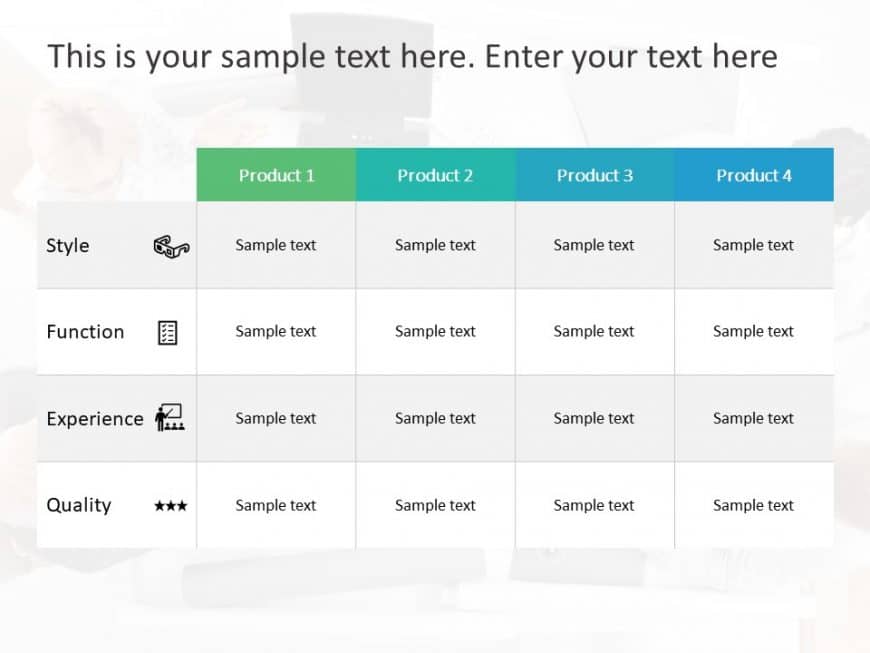
Product Pricing Presentation Template Use this Product Pricing PowerPoint template to create visually appealing presentations in any professional....

Problem Statement 2 Presentation Template Use this Problem Statement 2 PowerPoint template to create visually appealing presentations in any prof....

Corporate Market Share Comparison Diagram Presentation Template Use this Corporate Market Share Comparison Diagram PowerPoint template to create ....

Pros And Cons 2 Presentation Template Use this Pros And Cons 2 PowerPoint template to create visually appealing presentations in any professional....

Pricing Table Design Presentation Template Use this Pricing Table Design PowerPoint template to create visually appealing presentations in any pr....

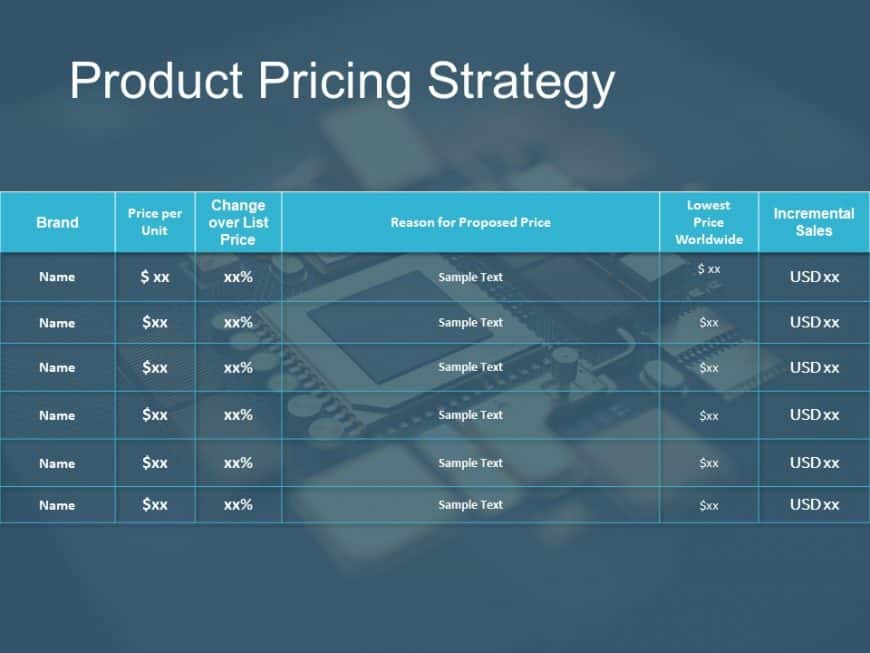
Product Pricing Strategy Presentation Template Use this Product Pricing Strategy PowerPoint template to create visually appealing presentations i....

Related Presentations

What Is A Comparison Table/Slide?

A comparison table is a cornerstone in presentations. These tables help in decision-making by showing the differences between data sets in a presentation slide. These slides also often use charts, infographics, or even Venn diagrams to showcase differences and similarities between the subjects. Presenting information with a side-by-side comparison helps the audience to grasp each option’s strengths and weaknesses efficiently.

Who Can Use These Comparison Slides?

Almost any business professional can use our professional comparison PowerPoint slides; here are a few use cases in business setting: 

1. Sales and Marketing Professionals: Comparison slides will help marketing and sales professionals show their services and product’s unique selling points. Our templates allow them to highlight major differences between their products and competitors, making convincing potential customers easier. 

2. Financial Analysts: Financial analysts can use our PowerPoint comparison charts to compare economic performance metrics, like revenue, profits, and ROI, to identify trends and areas for improvement. They can also analyze and compare financial data to identify investment opportunities and make informed decisions.

3. HR Professionals: Human Resource professionals can use these comparison slide templates to compare the qualifications and experience of various candidates to find the best one. HR professionals can also use them to conduct performance reviews of employees to understand whether there has been a growth or a dip and accordingly determine compensation levels.   

Why Choose Our Comparison PowerPoint Templates?

We offers various reasons to choose our comparison templates; a few of them are:

1. Visually Appealing: Our comparison slides are not only effective in breaking down complex information, but they are also visually eye-catching. The moment these slides show up on the screen, it catches the attention of everyone in the room. 

2. 100% Customizable: Our PowerPoint comparison charts and slides are entirely customizable! This means that every element you can see on the slide is editable to fit your requirements. You can change colors, text boxes, icons, design elements, font style, and a lot more. This allows you to personalize our slideshow templates to match your brand identity and make them into your slides.

3. Compatibility: Whether you prefer to use Microsoft PowerPoint or Google Slides, you don’t have to worry about compatibility issues, as all of our slides seamlessly integrate with both. This allows you to use our comparison Google Slides templates on the software of your choice without missing out on anything.

Product Pricing

Why Is Comparison During A Presentation Important?

Having a comparison during a presentation is important as it helps you showcase differences and similarities between two or more products, services, companies, strategies, and more. By visually showcasing differences, you can highlight key differences, build credibility, and help everyone in the room be on the same page, thus allowing everyone to weigh the pros and cons and then make informed decisions.

How To Make A Comparison Chart In PowerPoint?

If you want to create a comparison chart in PowerPoint, you can either use our pre-design comparison charts or create your own using the following steps.

1. Choose a suitable SmartArt layout that fits your needs.

2. When comparing multiple items, utilize tables, but if you want to show data visually, use bar charts, line charts, or others.

3. Add your text in the form of bullet points to keep it concise and neat.

4. Add icons to emphasize key differences.

5. Use contrasting colors to differentiate between items

6. Keep your slide uncluttered and let it speak for itself.