Product Description:
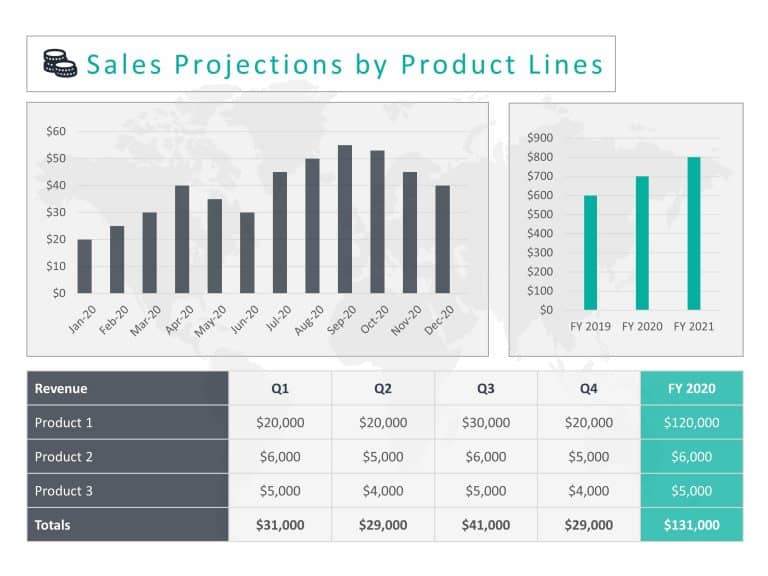
Explore concepts using this template with multiple line graphs that bring your data to life! Ideal, for highlighting trends and comparisons over time in an way with its modern design and vibrant blue color palette that boosts understanding and interest levels. The structured graph enables you to present datasets at once. Is perfect for professionals such, as project managers marketers or teachers wanting to demonstrate performance indicators or revenue increase.
The neat design guarantees that your audience can effortlessly grasp the content presented; additionally the adaptable text containers offer room, for your opinions and interpretations to be included seamlessly within the content structure Whether you are gearing up for a business gathering or a scholarly event this layout enhances your narrative with information.
Enhance your presentations with storytelling by downloading now! Find more such Graphs & Charts PowerPoint templates for engaging presentations. These templates are compatible with both PowerPoint and Google Slides.


