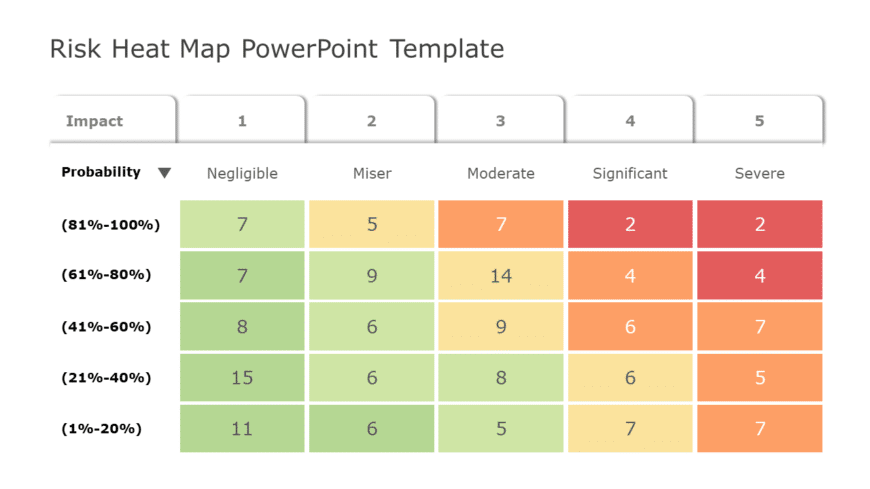
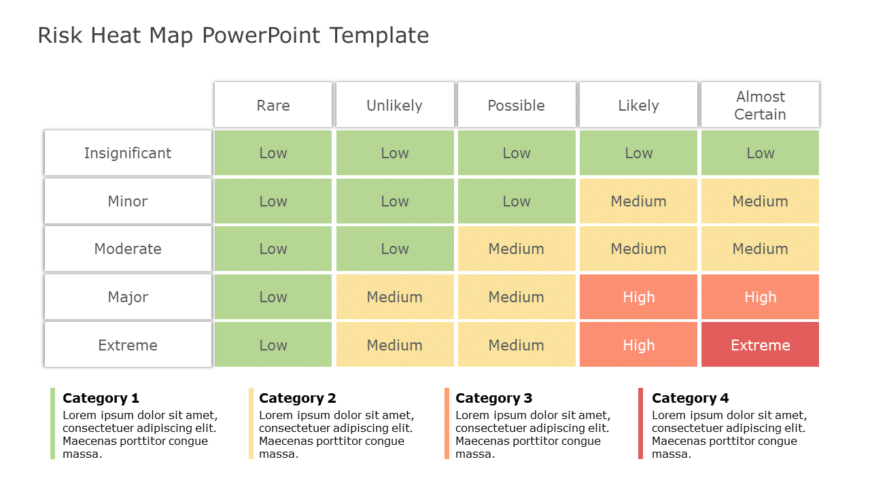
Wow your audience, with this eye catching tool created to make risk assessment easier and more understandable for everyone involved! This layout ....
Enhance the professionalism of your presentations using this crafted risk assessment heat map template crafted by experts! Ideal, for project man....
Enhance your risk management strategy with this user heat map template tailored to showcase insights effectively! By organizing risks according t....
Craft engaging presentations using this world heat map tool that is ideal, for business experts seeking to illustrate patterns in information acr....
Enhance your presentations with a heat map template tailored for risk analysis to add an edge to your work environment! Ideal, for project leader....
Enhance your storytelling by utilizing this evaluation tool created to illustrate business risks and opportunities in a format.This heat map desi....
Enhance your presentation using this eye catching template specifically created to simplify data representation in a visually appealing manner.Yo....


