 Fall Sale
 Flat 40% off on our Unlimited Access Yearly Membership plan!

Market Analysis PowerPoint Templates & Slides
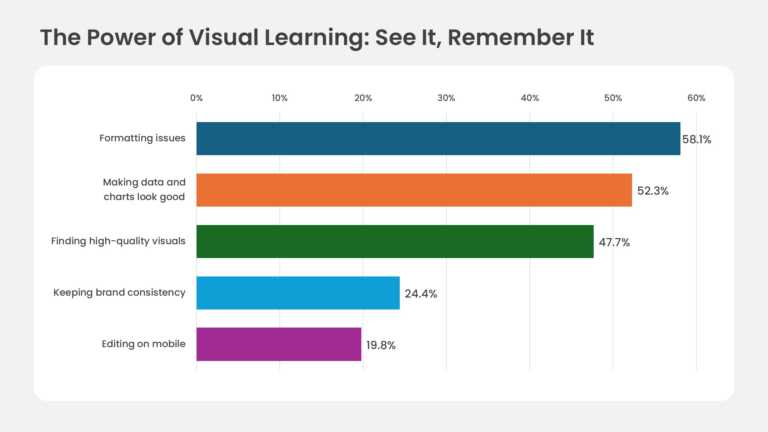
A horizontal bar graph with five ranked bars, percentage labels and a navy, orange, green, sky blue and magenta palette. The bars step down from ....
$5.99


