Flat 4


 Edit with AI
 Ask Us To Edit

Product Description:
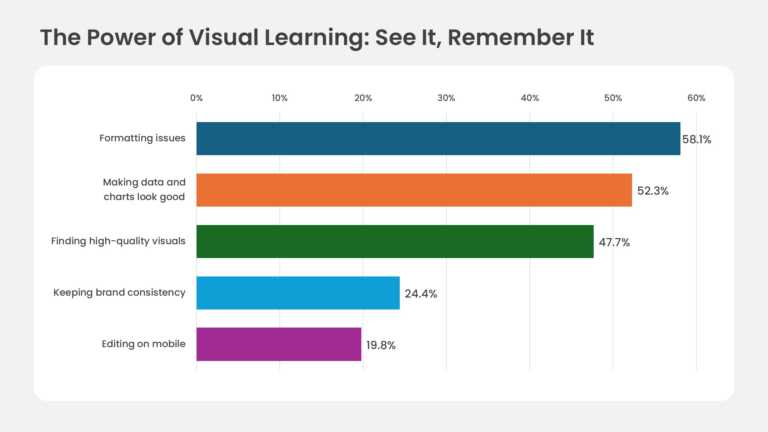
A horizontal bar graph with five ranked bars, percentage labels and a navy, orange, green, sky blue and magenta palette. The bars step down from 58.1% at the top to 19.8% at the bottom, so the ranking reads at a glance. A percentage axis from 0% to 60% runs above the chart, with light vertical gridlines. Category labels align to the left of each bar, and the exact value sits at each bar’s tip. A rounded white panel frames the chart on a soft gray background. In PowerPoint it is a native chart, so the bars resize when you update the data sheet.
A UX researcher can use it to report the top pain points from a user survey to the product team. The sample ranks presentation frustrations, from formatting issues down to editing on mobile. Stakeholders leave knowing which problem to fix first and how far it leads the rest.
Edit labels, values and bar colors to match your data, or explore more PowerPoint chart templates. To build a similar graph from scratch, follow our walkthrough on making a graph in PowerPoint. The slide comes in 16:9 and 4:3 and works in PowerPoint and Google Slides.