![]() Happy New Year
Happy New Year ![]() Flat 10% off on our Unlimited Access Yearly Membership plan!
Flat 10% off on our Unlimited Access Yearly Membership plan!


Statistics PowerPoint Templates & Slides
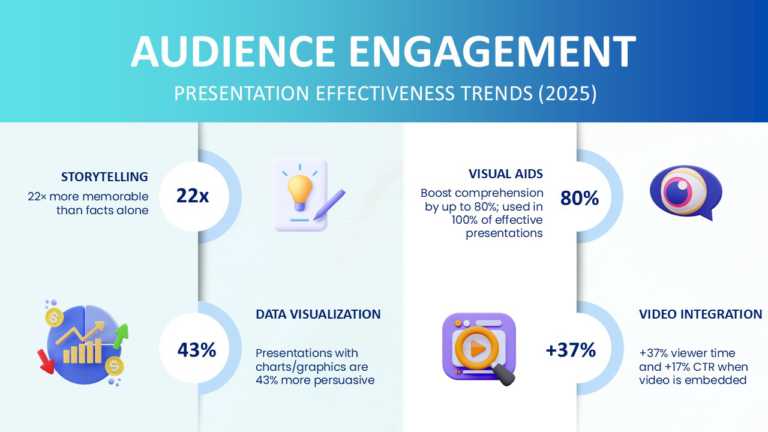
Enhance your meetings with this presentation template that showcases the audience engagement trends for 2025 in a colorful and dynamic layout tha....
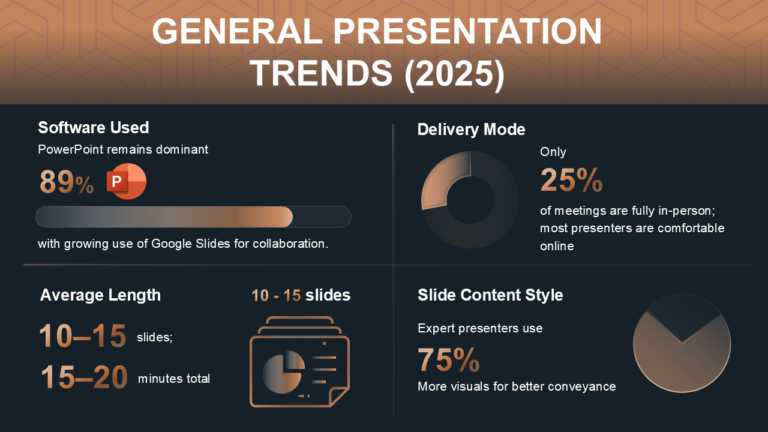
Enhance your presentation flow using this template tailored to display statistics and trends for the year 2025. Ideal for business professionals ....
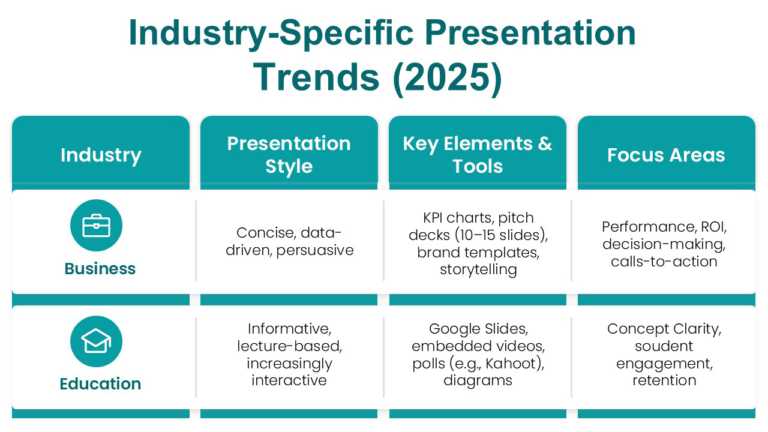
Get your ideas across using this template that’s made to feature presentation trends for 2025, in various industries, like business and edu....

The Pyramid Bar Chart PowerPoint Template is perfect for showing data. Be it a business professional, educator, researcher, or product manager, t....


The Marketing Budget Pie Chart PowerPoint Template is a resource for visually organizing and presenting the marketing budget, aiding in analysis,....

Enhance your presentation, with this survey findings template that highlights data trends effectively using a horizontal bar graph spanning multi....

Crafted to be clear and impactful is this template specifically designed for conducting variance analysis in presentations.This template boasts a....

Boost the quality and effectiveness of your presentations by using this all KPI balance sheet template that is crafted for communication and stro....

Showcase this thoughtfully crafted layout to impress stakeholders, for internal assessment purposes effortlessly.Use this template to highlight m....

Facts and Statistics Presentation Template Use this Facts and Statistics PowerPoint template to create visually appealing presentations in any pr....

Craft captivating presentations using this appealing summary tailored for internal assessment purposes.This design showcases a combination of gra....

Transform your data into a representation using this captivating template tailored for internal performance metrics analysis purposes! This slide....
Related Presentations
-

Outcomes
96 templates>
-

Increase Efficiency
7 templates>
-

Impact
33 templates>
-

Action Result
21 templates>
Key Features of High-Quality Statistics PowerPoint Templates
- Professionally designed templates with features like dynamic labels, responsive layouts, and automatic updates ensure that your data remains accurate and up-to-date, enhancing both trust and presentation quality. Clean designs eliminate clutter while highlighting key insights. Every element serves a purpose – from strategic colors to readable fonts.
- Customization is quick and effortless. Change colors and fonts with one click. Swap chart types without losing formatting. Connect live Excel data for automatic updates. No design experience is required to look professional.
- We help data tell its story. Animated builds reveal trends step by step. Dashboard slides summarize key metrics at a glance. Comparison layouts make differences instantly visible. Industry-specific templates fit your exact needs. Use statistics PowerPoint templates for free download to experiment with a variety of designs and styles.
- The results speak for themselves. 79% of executives prefer visual data (Forbes). Investors decide fast – make your numbers memorable. Our templates are refined through years of real-world use. Present your best case today. Try the statistics presentation template, which is designed to present data effectively and in a structured manner.
How Statistics PowerPoint Templates Can Enhance Your Presentations
- In today’s data-driven business environment, the ability to present statistics clearly and persuasively is a critical skill. Professionally designed statistics PowerPoint templates transform raw numbers into compelling visual stories that engage audiences and drive decision-making. These templates solve the universal challenge of making complex data accessible to diverse stakeholders, from executives to operational teams. Use a PowerPoint template for statistics that are structured to show data-driven insights.
- The right statistics template immediately elevates your presentation’s credibility. Instead of overwhelming spreadsheets or cluttered charts, you get clean, focused visualizations that highlight key insights at a glance. Research shows that audiences retain 65% of information when presented visually, compared to just 10% from text-heavy slides (MIT Sloan Management Review). This visual advantage is particularly crucial when presenting to time-pressed decision-makers who need to absorb information quickly.
- Modern statistics templates incorporate data visualization best practices that most professionals lack time to implement manually. They automatically apply optimal chart types for different data sets – using bar charts for comparisons, line graphs for trends, and pie charts for proportional relationships. The templates include built-in features like dynamic labels that adjust to your data, conditional formatting that highlights critical metrics, and responsive layouts that maintain clarity across devices. Use statistics powerpoint templates free download to experiment with different visual styles. Using a statistics PPT template with modern and minimalist designs can upgrade the feel of your presentation.
- Animation features in premium templates take data storytelling to the next level. Rather than displaying all the statistics at once, you can reveal information sequentially to guide your audience through the narrative. A well-timed animation might first show market size, then competitor share, before finally revealing your growth opportunity – building understanding step-by-step. These subtle motion designs increase engagement without distracting from the content. Animated statistics presentation templates help improve engagement and retention. Use a powerpoint template for statistics, workflow, and other analytical data. You can experiment with the statistics PPT free download and explore what designs and structures suit your presentation style.
- Customization flexibility ensures that the templates work for your specific needs while maintaining a professional polish. With one-click theme colors, you can match your corporate branding instantly. Drag-and-drop functionality lets you rearrange elements without breaking the design. Live data linking means your slides update automatically when source spreadsheets change – a game-changer for quarterly business reviews or ongoing project tracking. Use the statistics PPT template designed to give you flexibility.
- The business impact is measurable. Companies using professional statistics templates report 40% shorter decision cycles (Gartner) because stakeholders reach consensus faster when data is presented clearly. Sales teams using visual data templates close 28% more deals by making value propositions undeniable (Harvard Business Review). Executives find they spend less time explaining numbers and more time discussing implications. Use the statistics slide template designed to show cycles and propositions clearly.
- Beyond the immediate presentation, these templates create lasting value. They establish a consistent data visualization language across your organization, making cross-departmental communication more efficient. The templates serve as training tools, teaching teams how to present data effectively through their built-in best practices. Many clients report that the templates improve their data collection processes as teams become more intentional about what metrics matter most. Use a strategically designed statistics presentation template to improve data visualization.
- For industries with particularly complex data – financial services, healthcare analytics, market research – specialized templates provide domain-specific frameworks. These include pre-formatted risk assessment models, clinical trial result visualizations, or consumer segmentation matrices that would take days to create from scratch. The time savings alone often justify the investment before considering the improved communication outcomes. Improve your efficiency by using the statistics slide template designed to improve speed and efficiency. You can also experiment with statistics ppt free download to explore what kind of designs suit your presentation styles.
How To Incorporate Statistics Templates Into Your PowerPoint Presentation
- Choosing the Right Template: Pick templates designed for your specific data needs. Growth trends work best with line chart templates. Comparisons shine in bar chart formats. Market shares pop in pie chart designs. Financial data fits waterfall chart templates perfectly. Use a statistics PPT template that fits your niche and brand storytelling.
- Easy Data Import: Simply paste your Excel data into pre-formatted placeholders. Charts automatically update to fit your numbers. No manual resizing is needed. All calculations update instantly. Use the statistics presentation template that allows effective import data without any hassle.
- Smart Customization: Change colors with one click to match your brand. Text boxes adjust automatically to your content. Highlight key stats with built-in callouts. Toggle data layers on/off during presentations. Use a powerpoint template for statistics that are easily customizable into your desired style.
- Effective Animations: Reveal data points one by one for clarity. Zoom in on important metrics when speaking. Create smooth transitions between related slides. Keep animations subtle but impactful. Use an animated statistics slide template designed with subtle yet effective animations and animated infographics.
- Final Polish: Check all slides for consistent branding. Verify that data labels are clear and accurate. Test all interactive features. Practice your timing with the built-in coach. You should always experiment with statistics ppt free download to explore what kinds of infographics will be the best choice for your slides.
- Quick Workflow: 15 minutes to select and prep your template. 10 minutes to import your data. 20 minutes for customization. 15 minutes to add finishing touches. Always do a final 10-minute rehearsal. Experiment with statistics ppt free download to explore from a wide variety, which designs and visual structure of statistical data will suit your presentation slides.
Pro Tip: Use the template’s “Focus Mode” to highlight key slides during delivery. This keeps your audience engaged with the most important data points. Always experiment with powerpoint templates for statistics and their compatibility with various other relevant templates.