Product Description:
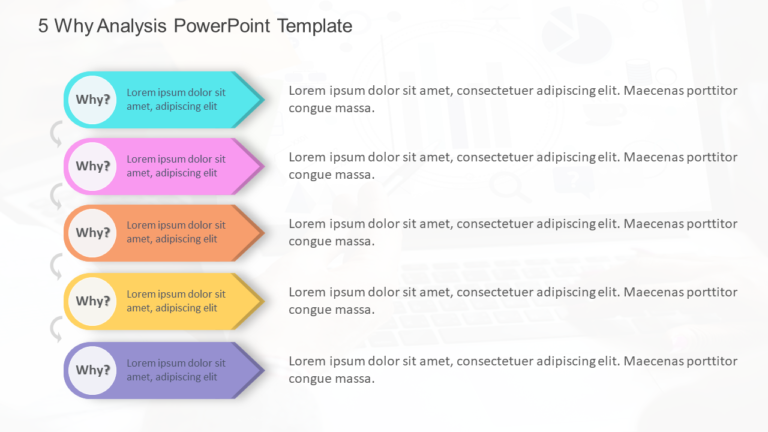
Crafted to be clear and impactful is this template specifically designed for conducting variance analysis in presentations.This template boasts an aesthetic highlighted by teal and purple tones that serve as an engaging backdrop to showcase your data.Its layout incorporates components facilitating seamless comparison and analysis—ideal, for finance experts and business analysts seeking to present intricate information concisely.
This template is perfect, for use in meetings and financial assessments as it assists in analyzing differences, in budgets and projections to help your audience easily understand the takeaways effectively.Its stylish layout not enhances the appeal of your data. Also aids in improving comprehension and memory retention.
Begin today. Change your presentations into captivating stories that influence decisions! Find more such Data Visualization PowerPoint templates for engaging presentations. These templates are compatible with both PowerPoint and Google Slides.


