Product Description:
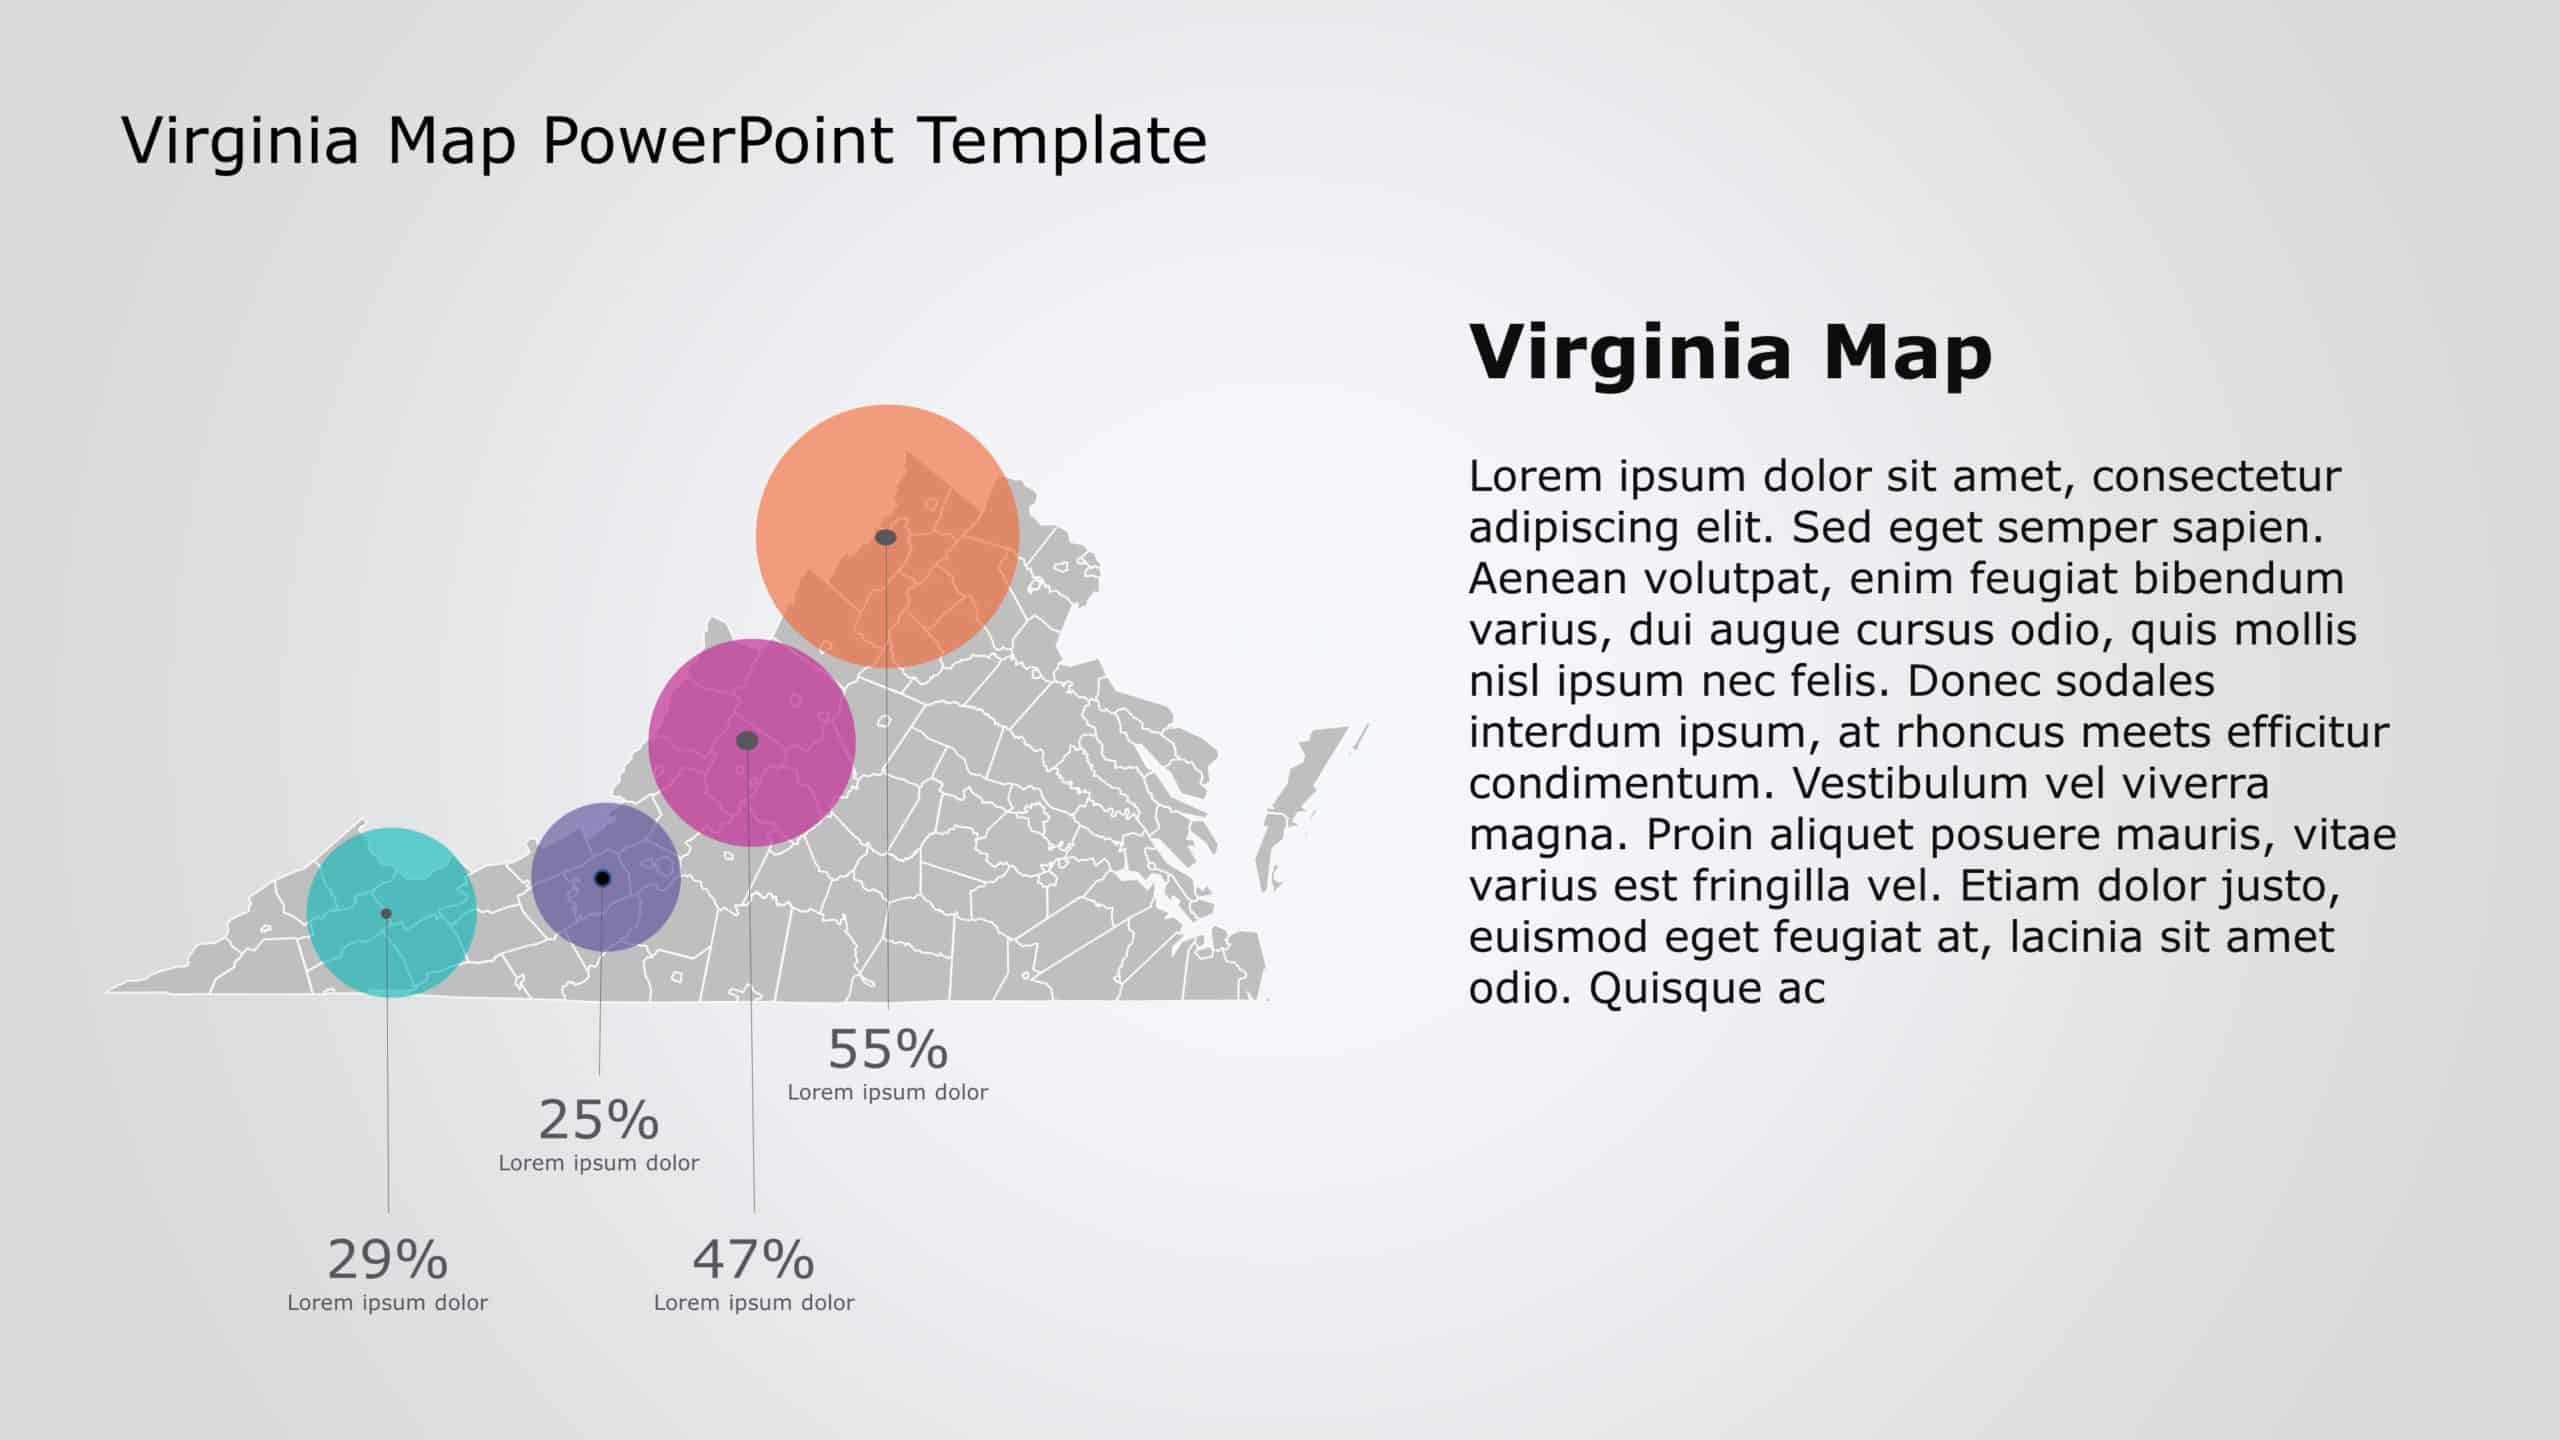
Take your meetings to the next level with this engaging visual tool that showcases data in a clear and colorful way! This template features a detailed map of Virginia, enhanced with vibrant percentage bubbles that make it easy to present key statistics at a glance. Ideal for business professionals, educators, and analysts, this design allows you to effectively communicate geographical data and insights.
The layout is clean and modern, utilizing a soothing color palette that draws attention without overwhelming the audience. Each bubble can represent various metrics, making it perfect for presentations on market analysis, demographic studies, or strategic planning sessions.
Whether you’re discussing sales performance across regions or highlighting community engagement, this template ensures your message is not only heard but also visually impactful.
Download now and transform your data into compelling narratives that captivate your audience! Find more such Map PowerPoint templates for engaging presentations. These templates are compatible with both PowerPoint and Google Slides.


