Product Description:
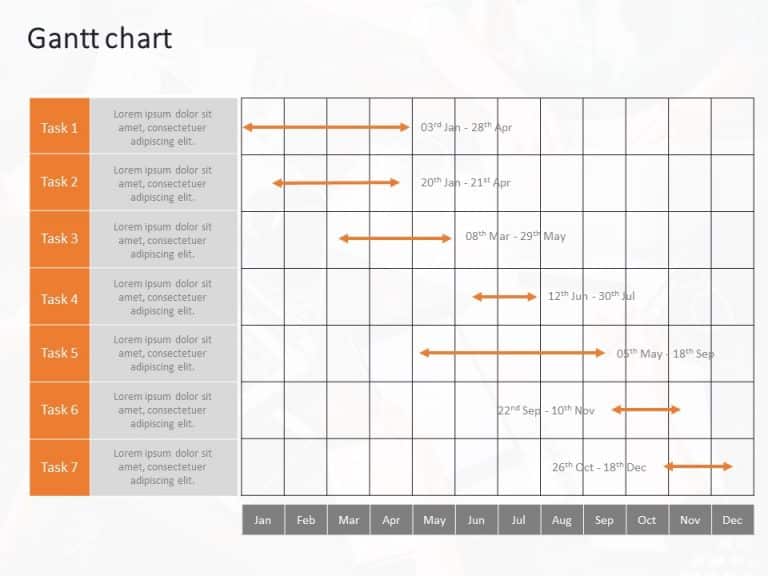
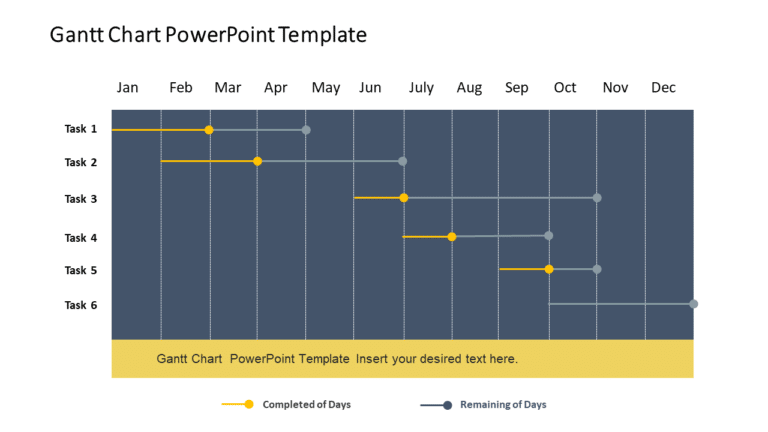
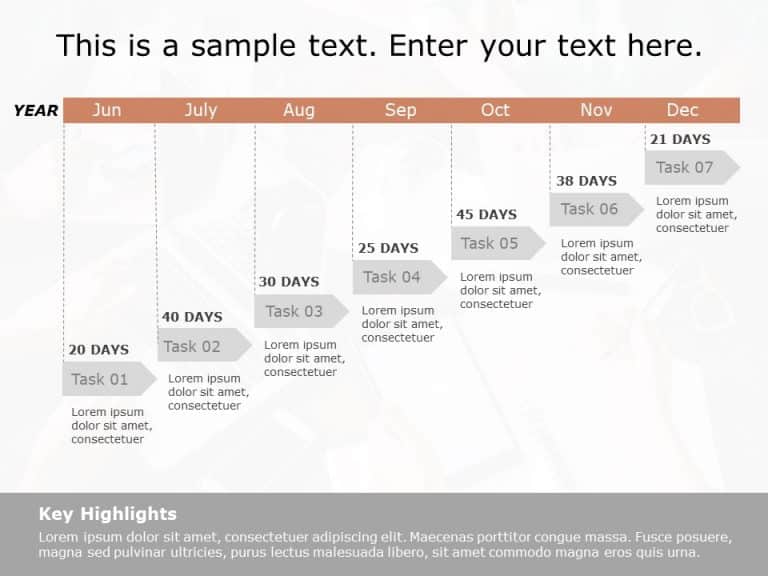
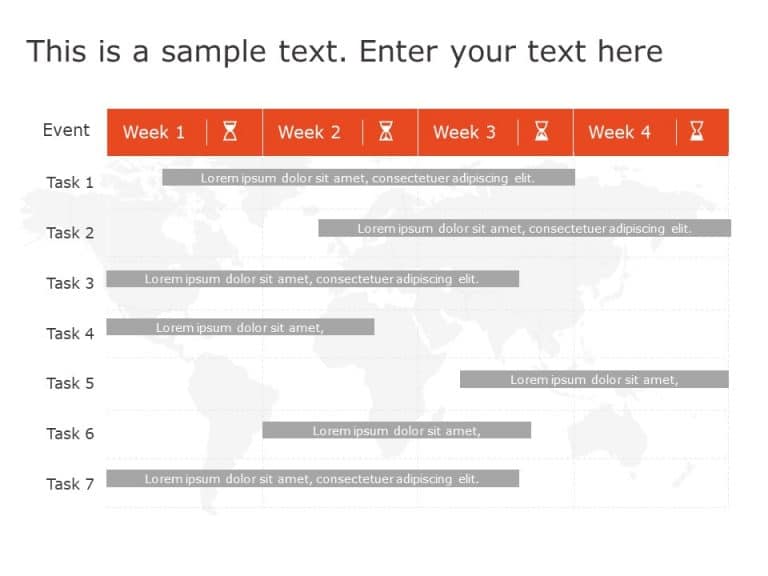
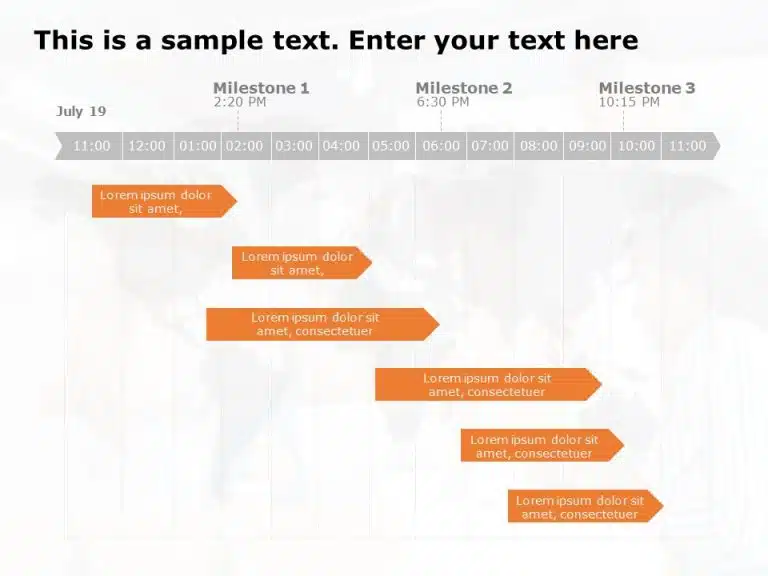
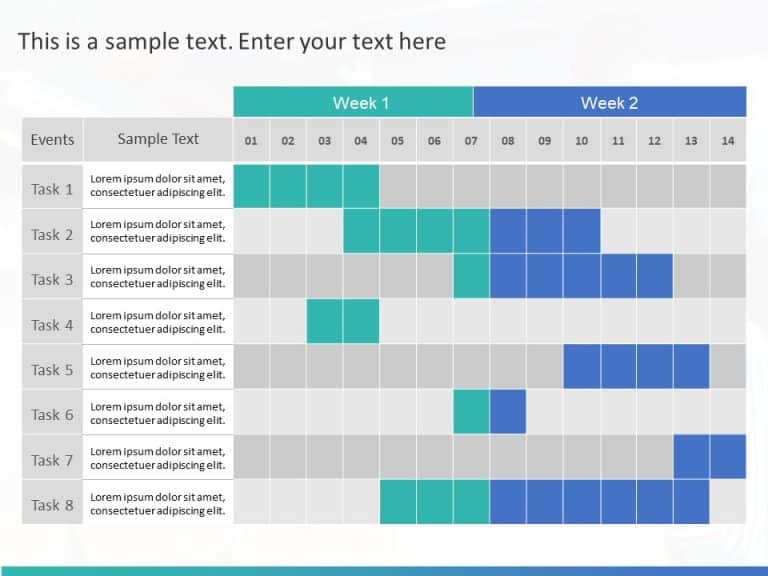
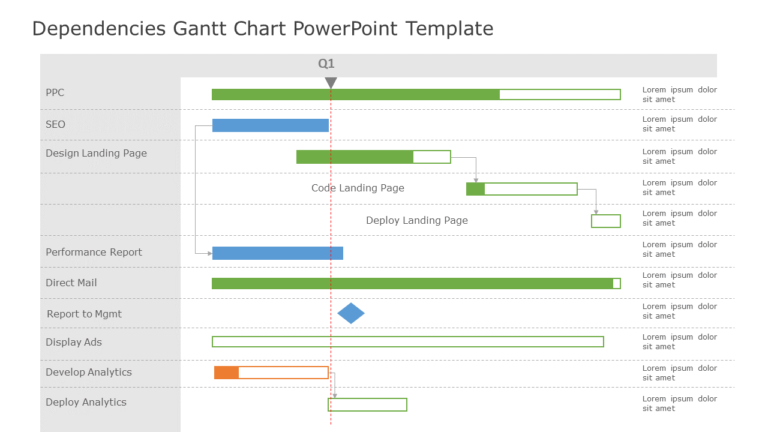
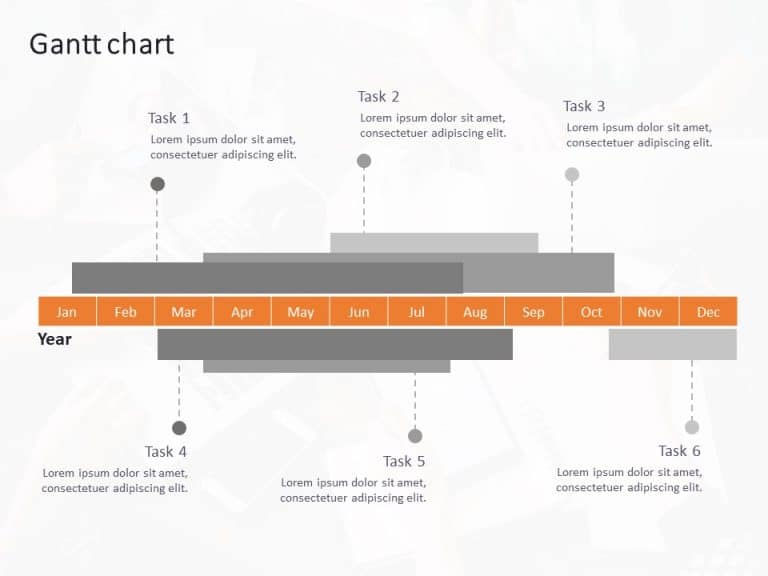
This Gantt Chart Template has been created to display tasks clearly over time. It offers an effective way to manage and visually represent a project timeline. It provides the duration of the allocated tasks. It also includes the start and end dates of each task.
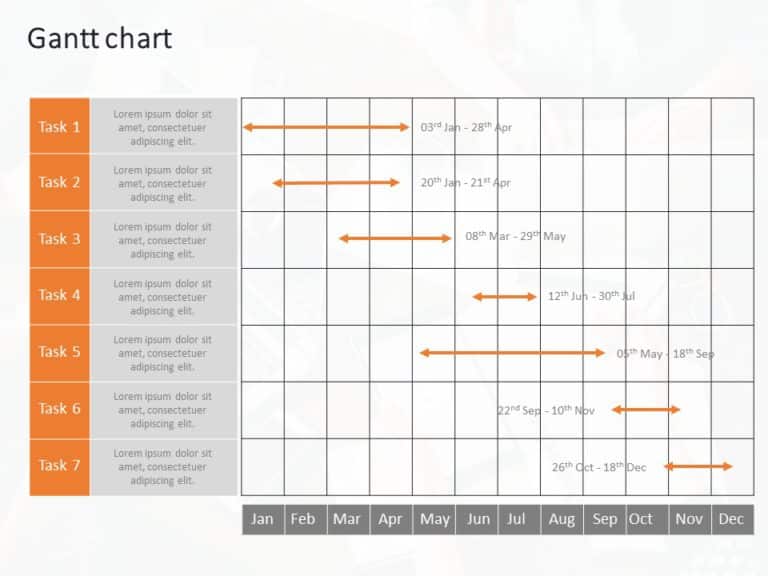
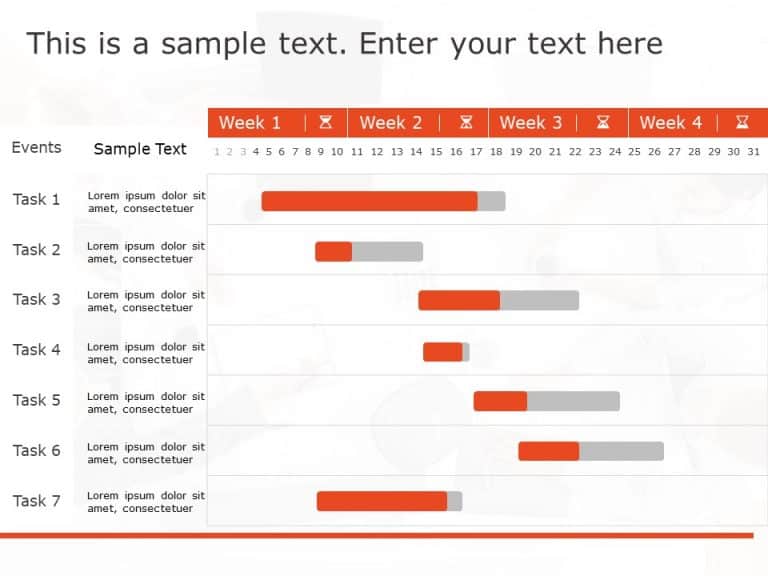
This PowerPoint Gantt chart template has a color palette of orange and gray against a white background. There is a column on the left that states the number of tasks, and the elaboration is done in the column next to it. There are seven tasks mentioned in total, represented by arrows. The row at the bottom has the months of the year that gives clarity of the task duration.
Such business PPT templates can be used to plan events requiring detailed scheduling over days or weeks. Team leaders and managers can monitor team tasks, especially when managing projects with strict deadlines. It can be customized according to the project plan and schedule. Additionally, it is compatible with PowerPoint and Google Slides.


