 Fall Sale
 Flat 40% off on our Unlimited Access Yearly Membership plan!


Enhance your presentation, with this captivating map template tailored for displaying data points throughout Russia in a visually appealing way! ....


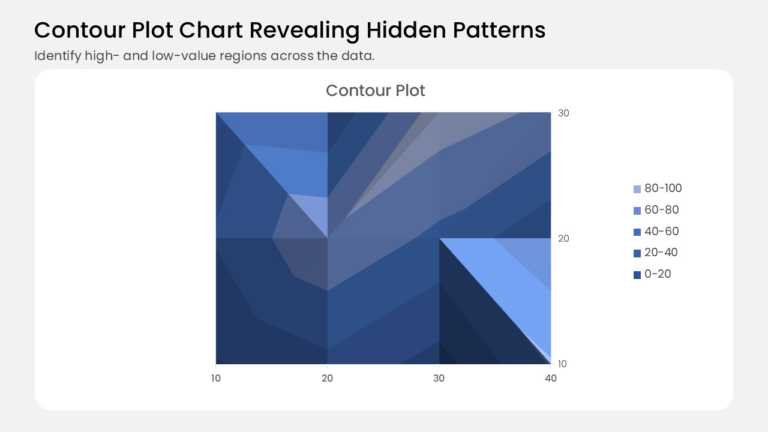
This contour plot turns a grid of values into shaded bands, like a topographic map for your data. It plots 12 data points on a 4 × 3 grid, with 1....
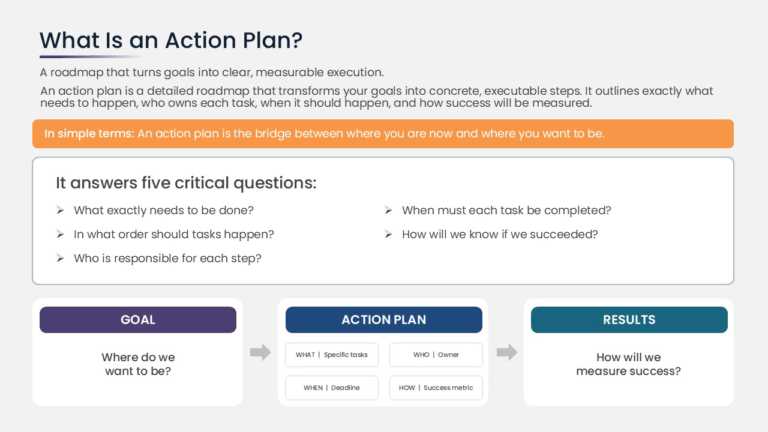
The Action Plan Process Overview PowerPoint And Google Slides Template helps users explain what an action plan is and how it connects goals to re....
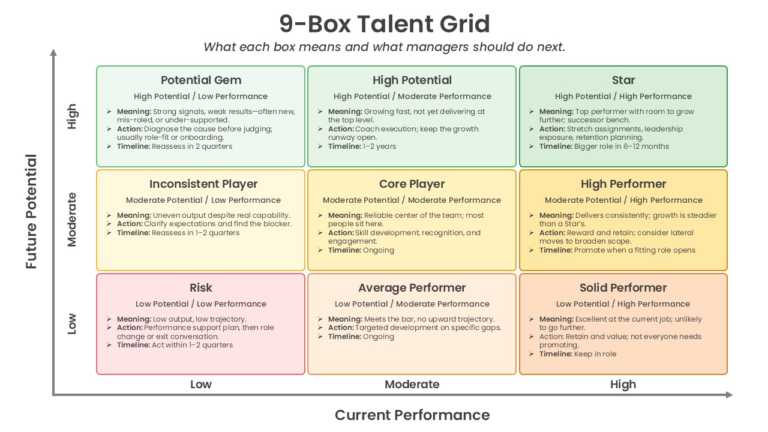
The Animated PowerPoint Template is designed to present employee performance and potential assessments using an animated 9-box grid framework. It....

The Animated PowerPoint Template is designed to present environmental topics, sustainability initiatives, and climate-related concepts using coor....

The Presentation Template is designed to deliver project management training through structured presentation layouts covering key concepts, proce....