Product Description:
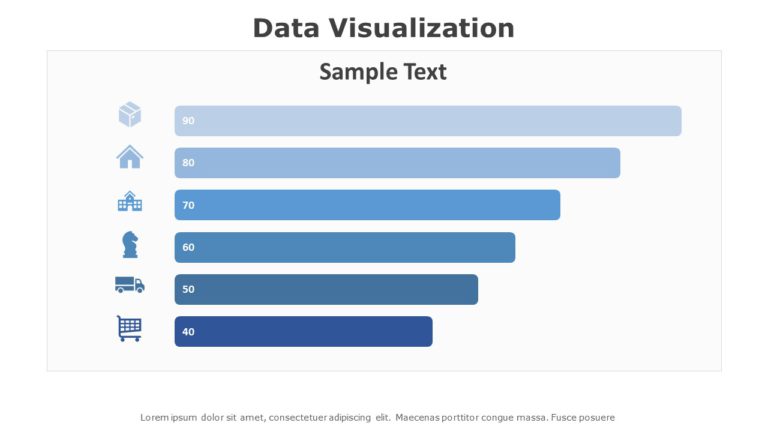
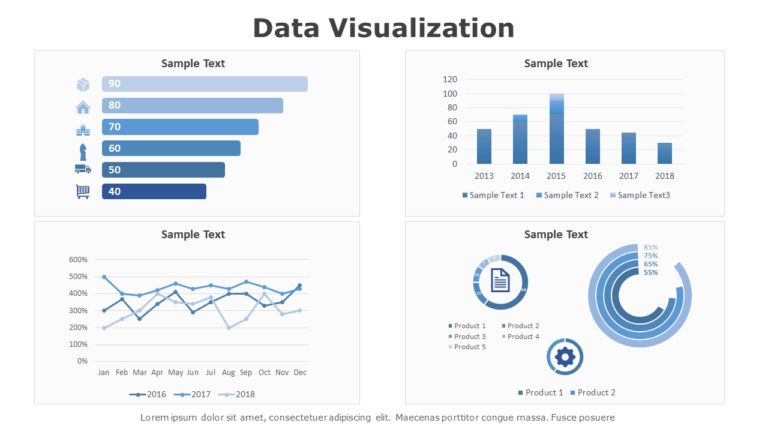
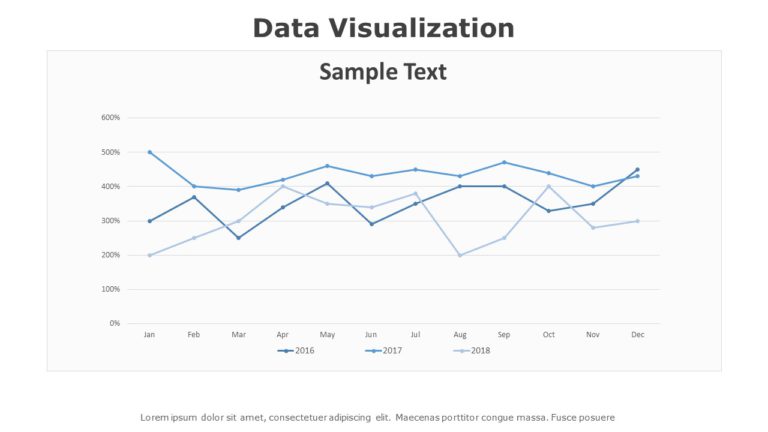
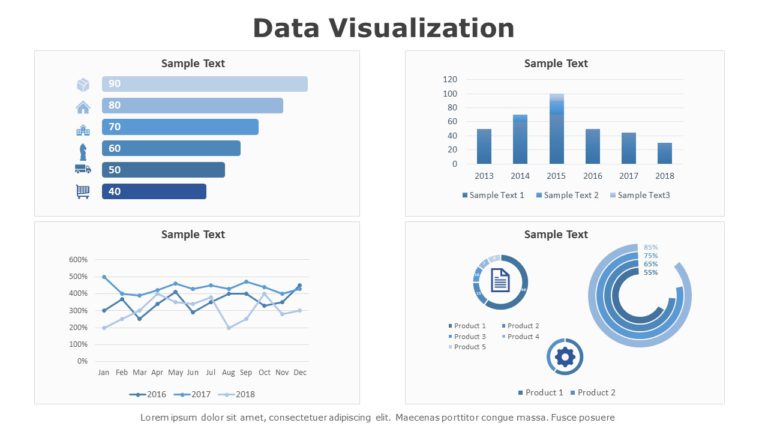
The Animated Data Visualization Template helps present various data sets in an attractive and visual way. Data can be presented accurately to talk about different sectors of interest in an organization using a Push transition.
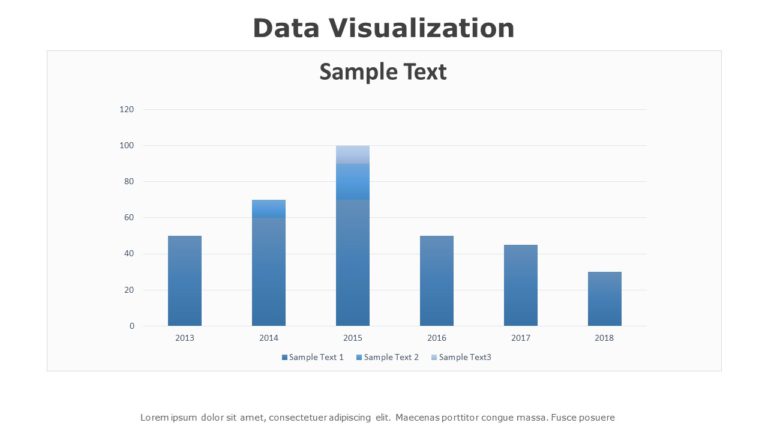
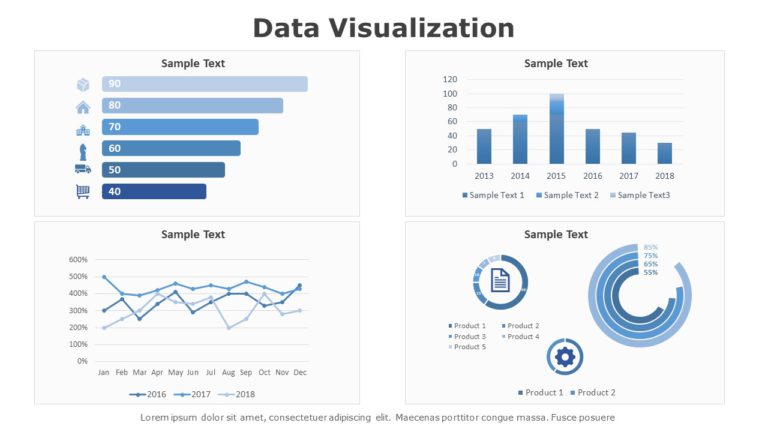
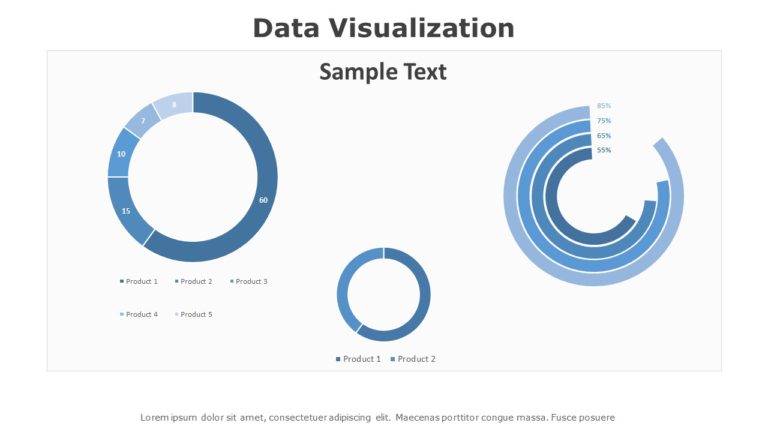
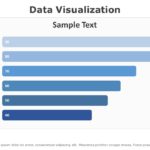
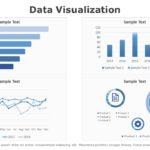
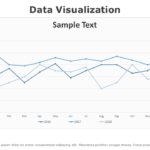
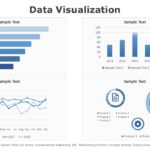
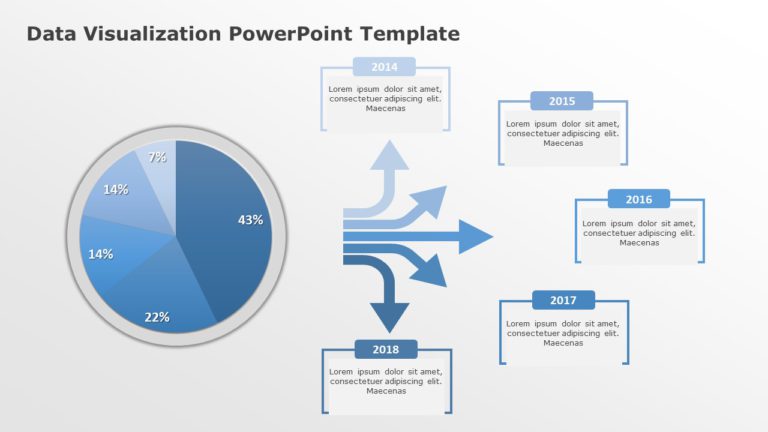
These data visualization slides use a blue-white color theme across multiple slides to depict data through various modes. These include bar graphs, line graphs, and pie charts, which can be used to depict the different kinds of data types visually. Each slide transitions into the next with a Push transition, where the main slide connects each individual graph slide.
These animated PowerPoint templates can be used in business settings when research findings or project updates need to be provided to the audience. It can be used by anyone who has multiple data sets and requires these depiction tools. This template is fully editable and can be customized according to the user’s requirements. It is also compatible with PowerPoint and Google Slides for added convenience.


