Product Description:
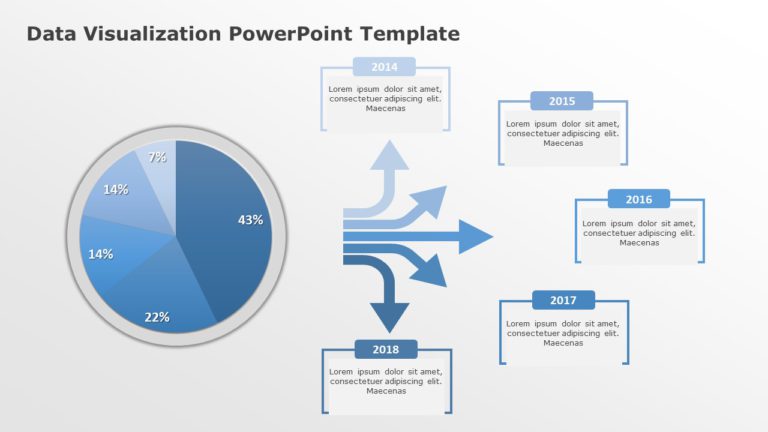
Enhance your presentation with this set of data visualization graphs tailored to enhance your narrative ! With a color scheme of grey hues incorporated in this template are various types of charts including tree maps and pie charts, along with semi circle charts and bubble charts as well as line charts and stacked charts. Each meticulously designed to present intricate data in a straightforward and captivating style ideal for professionals in business sectors or educational fields as well, as analysts.
The tree map chart makes it simple to compare data easily; the exploded pie chart effectively emphasizes segments; the semi circle chart is great, for presenting progress or performance metrics; and the bubble chart offers a distinct perspective on visualizing relationships between variables. Tracking trends, over time is best done with a line chart; while a stacked chart gives a view of data series.
Get ready, for your meeting or educational presentation, with this template that will help you create engaging visuals that will capture your audiences attention instantly! Find more such Data Visualization PowerPoint templates for engaging presentations. These templates are compatible with both PowerPoint and Google Slides.


