Product Description:
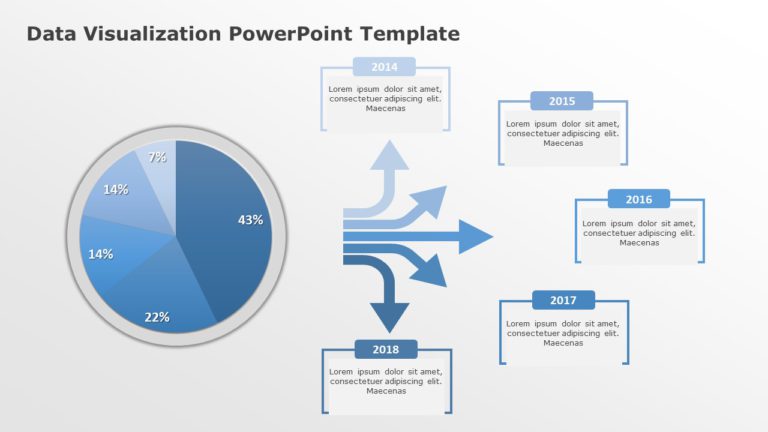
Elevate your meetings with this captivating dashboard crafted for presenting data ! The template showcases a color palette that boosts clarity and concentration. Ideal, for corporate experts and data analysts alike.
The design features bar and line graphs that help display metrics and trends with ease. The infographics are user friendly. Make it simple for your audience to understand data promptly. Perfect for conversations, about quarterly outcomes or projections for projects. By incorporating both bars and line graphs effectively presents a holistic perspective of your data which is valuable, for strategic planning meetings or evaluations of performance.
Each slide is carefully designed to enhance communication so that your ideasre not only visible but also comprehensible, to your audience easily. Elevate the quality of your presentations. Spur conversations using this effective visual aid tool.
Get it now. Convert your information into engaging narratives that connect with your audience! Find more such Data Visualization PowerPoint templates for engaging presentations. These templates are compatible with both PowerPoint and Google Slides.


