Product Description:
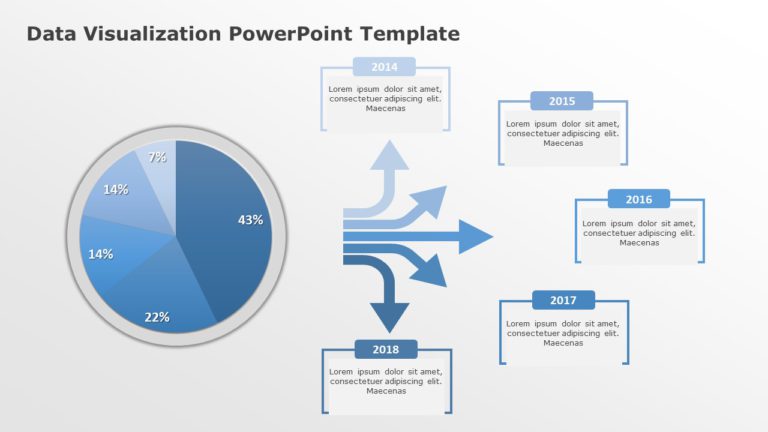
Create a story using this set of data visualization charts that are designed to help professionals effectively communicate information in an aesthetically pleasing manner.
The design features types of charts, like bar graphs and pie charts to present trends and comparisons for business analysts and educators alike This template aims to enhance discussions, in meetings or presentations.
Every slide is carefully designed to showcase data points that keep your audience interested and well informed_. With elements that’re simple, to modify_ you can personalize the visuals to suit your requirements_ simplifying data analysis and making a significant impact_.
Enhance your data storytelling skills by downloading to create narratives that shape decision making processes. Find more such Data Visualization PowerPoint templates for engaging presentations. These templates are compatible with both PowerPoint and Google Slides.


