Product Description:
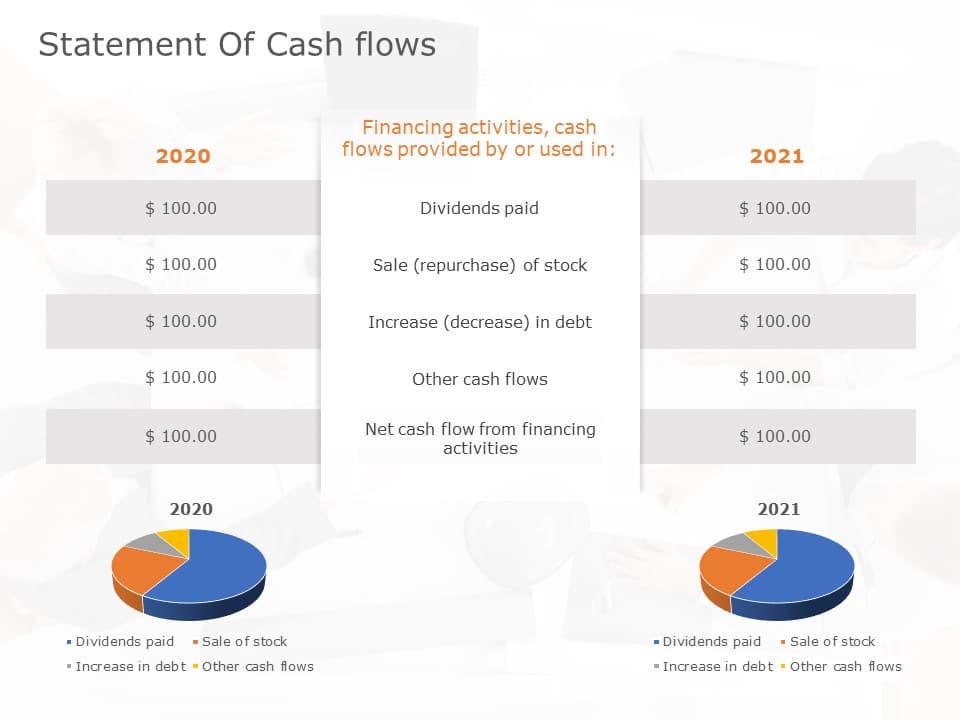
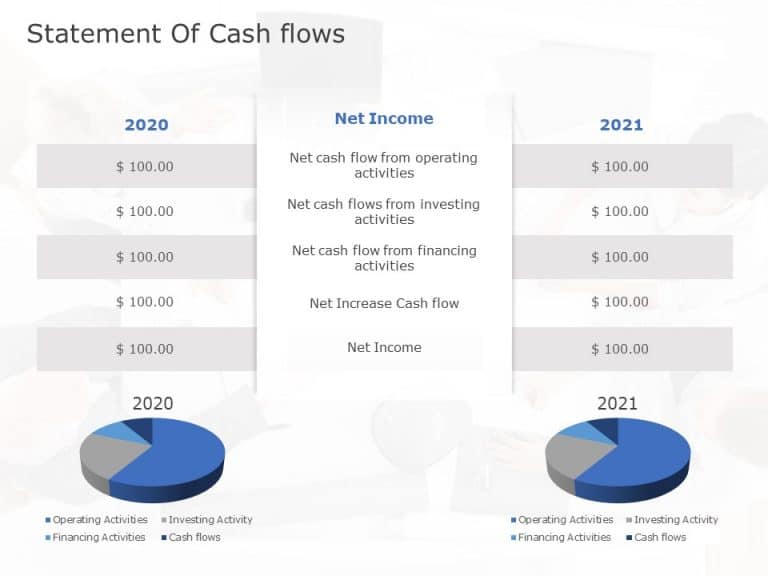
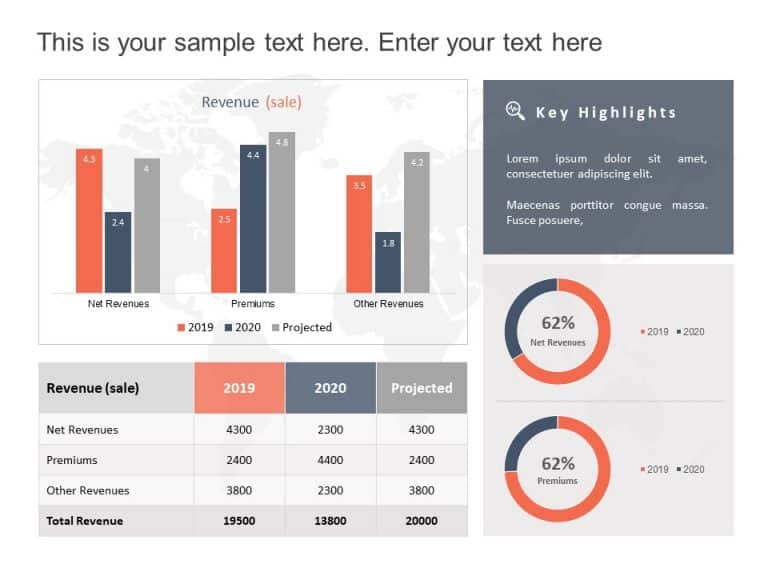
Grab your audiences interest, from the get go with this chart template for comparing cash flow statements! Tailored for finance experts like yourself this template streamlines the display of information making it a breeze to compare cash flows, between 2020 and 2021.The classy mix of orange and gray not boosts readability but also infuses a sense of professionalism into your presentations.
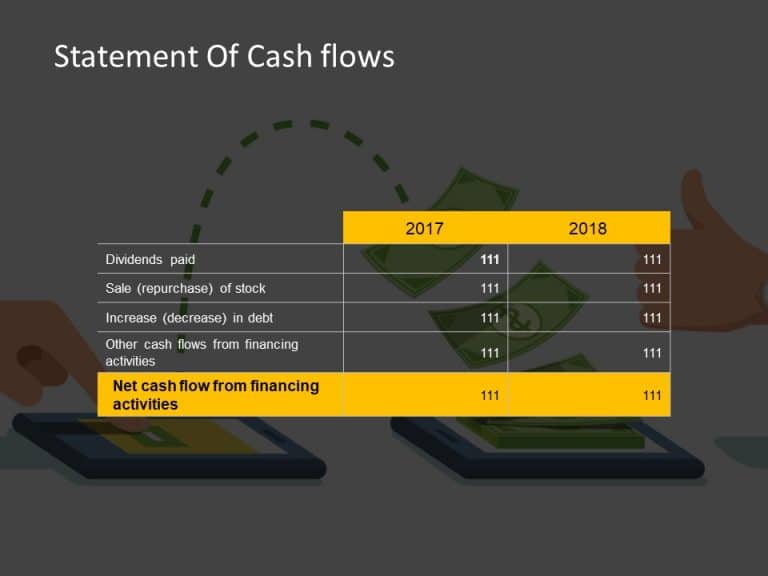
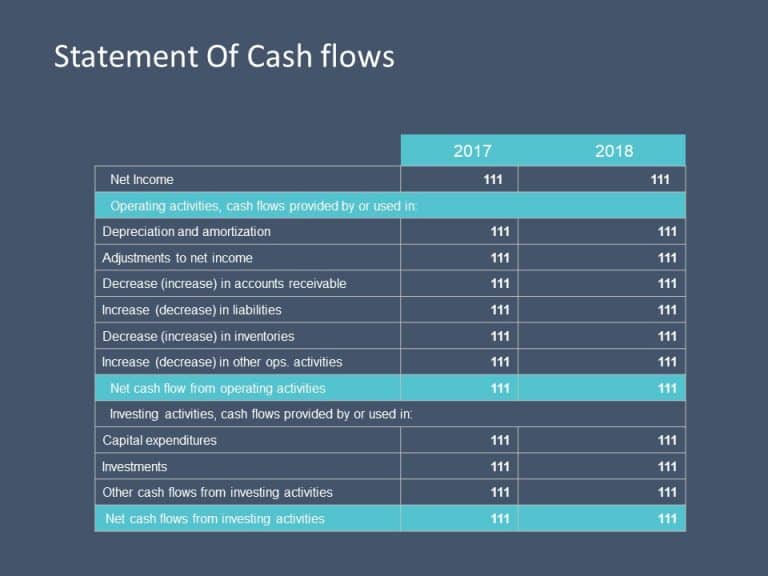
This template includes organized sections, for dividends received and paid out as stock sales and changes in debt and other cash flows to help you present detailed information in a simple format easily understandable by various audiences like corporate meetings or financial discussions, with the support of pie charts that visually represent the different components of cash flow.
Calling out to accountants and financial analysts alike. This template is designed to simplify your reporting tasks and effectively communicate information to elevate your presentations effortlessly. Find more such Finance PowerPoint templates for engaging presentations. These templates are compatible with both PowerPoint and Google Slides.

