Product Description:
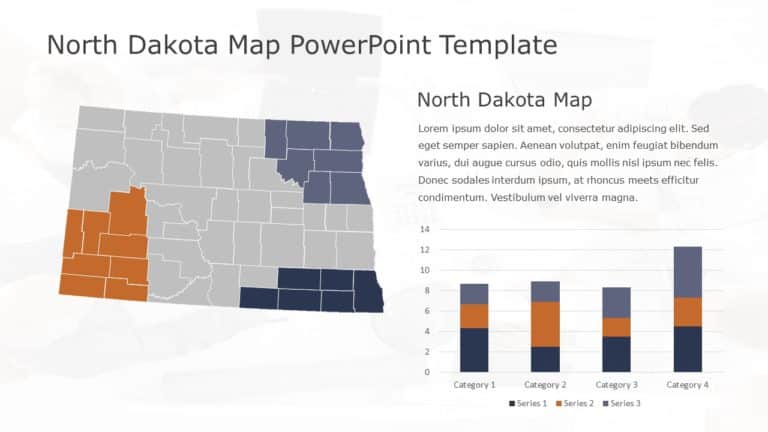
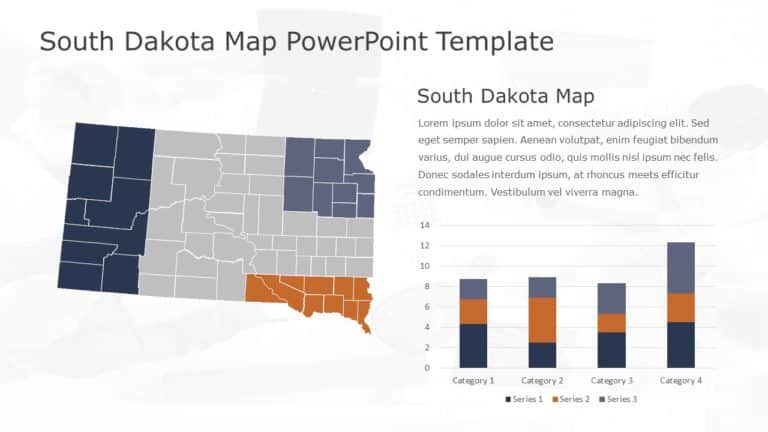
Make your presentation stand out with this engaging map analysis template designed specifically for showcasing data in Connecticut. Featuring a vibrant orange and blue color scheme, this template not only captures attention but also enhances clarity, making complex information easy to digest.
The layout includes a detailed map of Connecticut, allowing you to visually represent geographical data and trends effectively. Accompanied by a sleek bar chart, this template is perfect for presenting statistical comparisons across different categories, ideal for business meetings, educational sessions, or strategic planning discussions.
Whether you’re a corporate professional analyzing market trends or an educator presenting demographic data, this template caters to your needs with its user-friendly design and informative visuals.
Download now and transform your data into compelling presentations that resonate with your audience! Find more such Map PowerPoint templates for engaging presentations. These templates are compatible with both PowerPoint and Google Slides.


