Product Description:
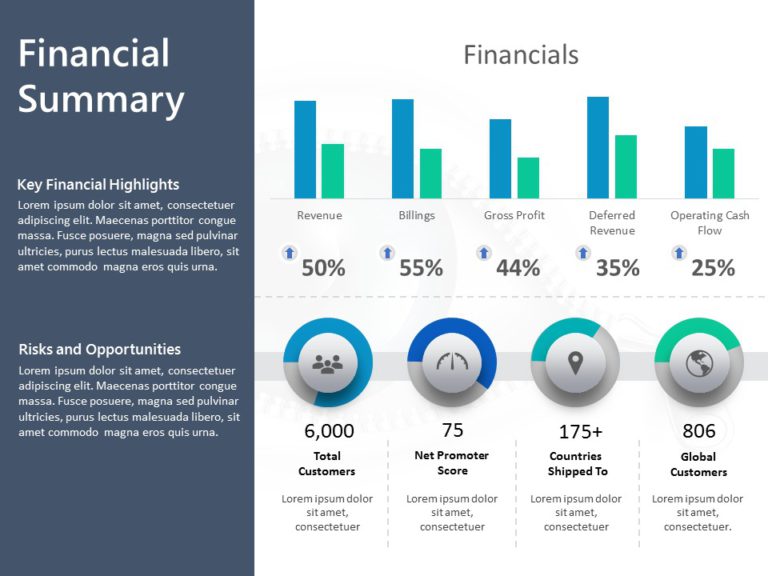
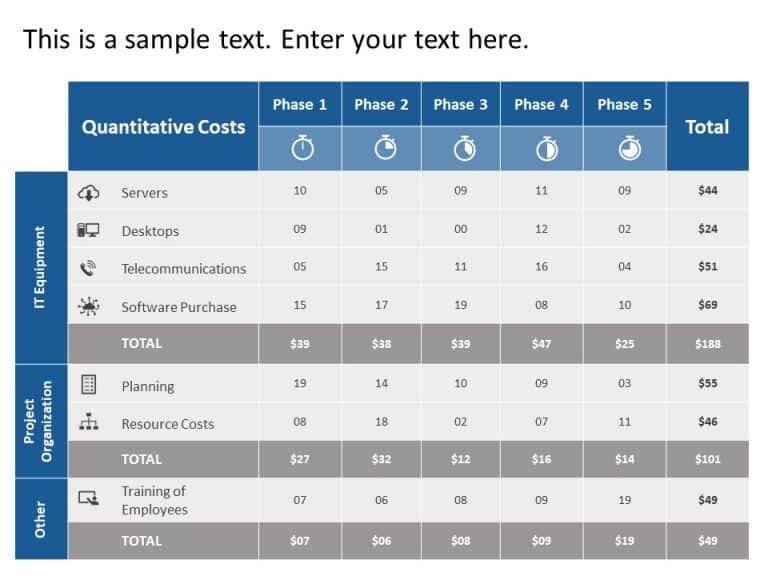
Crafted to be clear and impactful while elevating your presentations is this financial summary chart that is designed to assist business individuals in gaining insights, into their financial standing spanning from 2019 to 2023 by displaying essential figures like revenue generation and expenditures along, with net profits in an organized manner through its stylish blue layout which facilitates trend analysis and strategic decision making processes.
The design is easy to use. Helps you explain financial details in a simple way for your audience to understand easily since each part is clearly marked out. It’s perfect, for business meetings as evaluations of financial data or brainstorm sessions for planning ahead. It’s definitely a useful tool, for anyone wanting to communicate financial information effectively.
Upgrade your presentations to the level by downloading now! Find more such Finance PowerPoint templates for engaging presentations. These templates are compatible with both PowerPoint and Google Slides.


