Product Description:
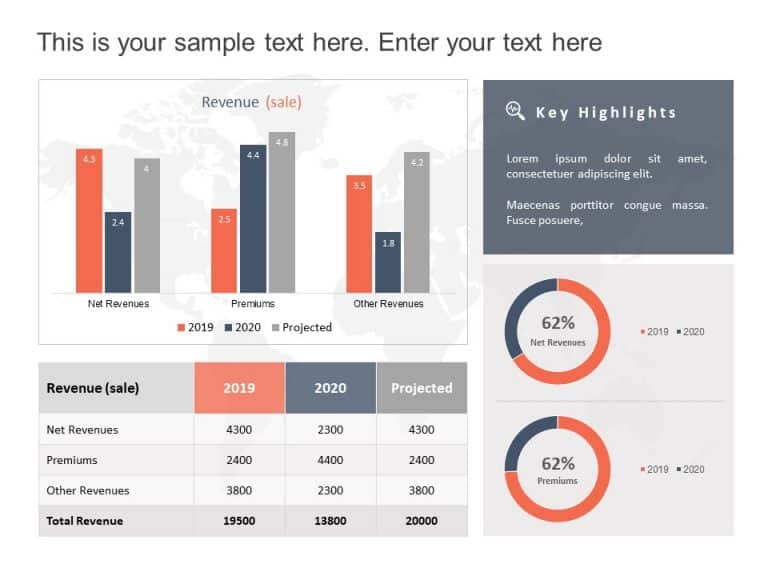
This template is great, for team meetings as it turns data into captivating visuals with its sleek design and colorful test tube infographics that showcase progress over several years effectively, for presentations centered around growth metrics or performance analysis purposes each test tube symbolizing a different year and clearly illustrating percentages to emphasize trends and accomplishments.
The neat arrangement and lively hues keep your audience interested; the straightforward yet efficient layout makes customization a breeze! Whether you’re sharing with business executives or classmates or team members on a project‚Äîthis template is designed to suit your requirements.
Enhance your data presentations by using this infographic to showcase your discoveries or monitor advancement, towards objectives. Download now to enhance the appeal and information value of your materials! Find more such PowerPoint Diagram templates for engaging presentations. These templates are compatible with both PowerPoint and Google Slides.


