Product Description:
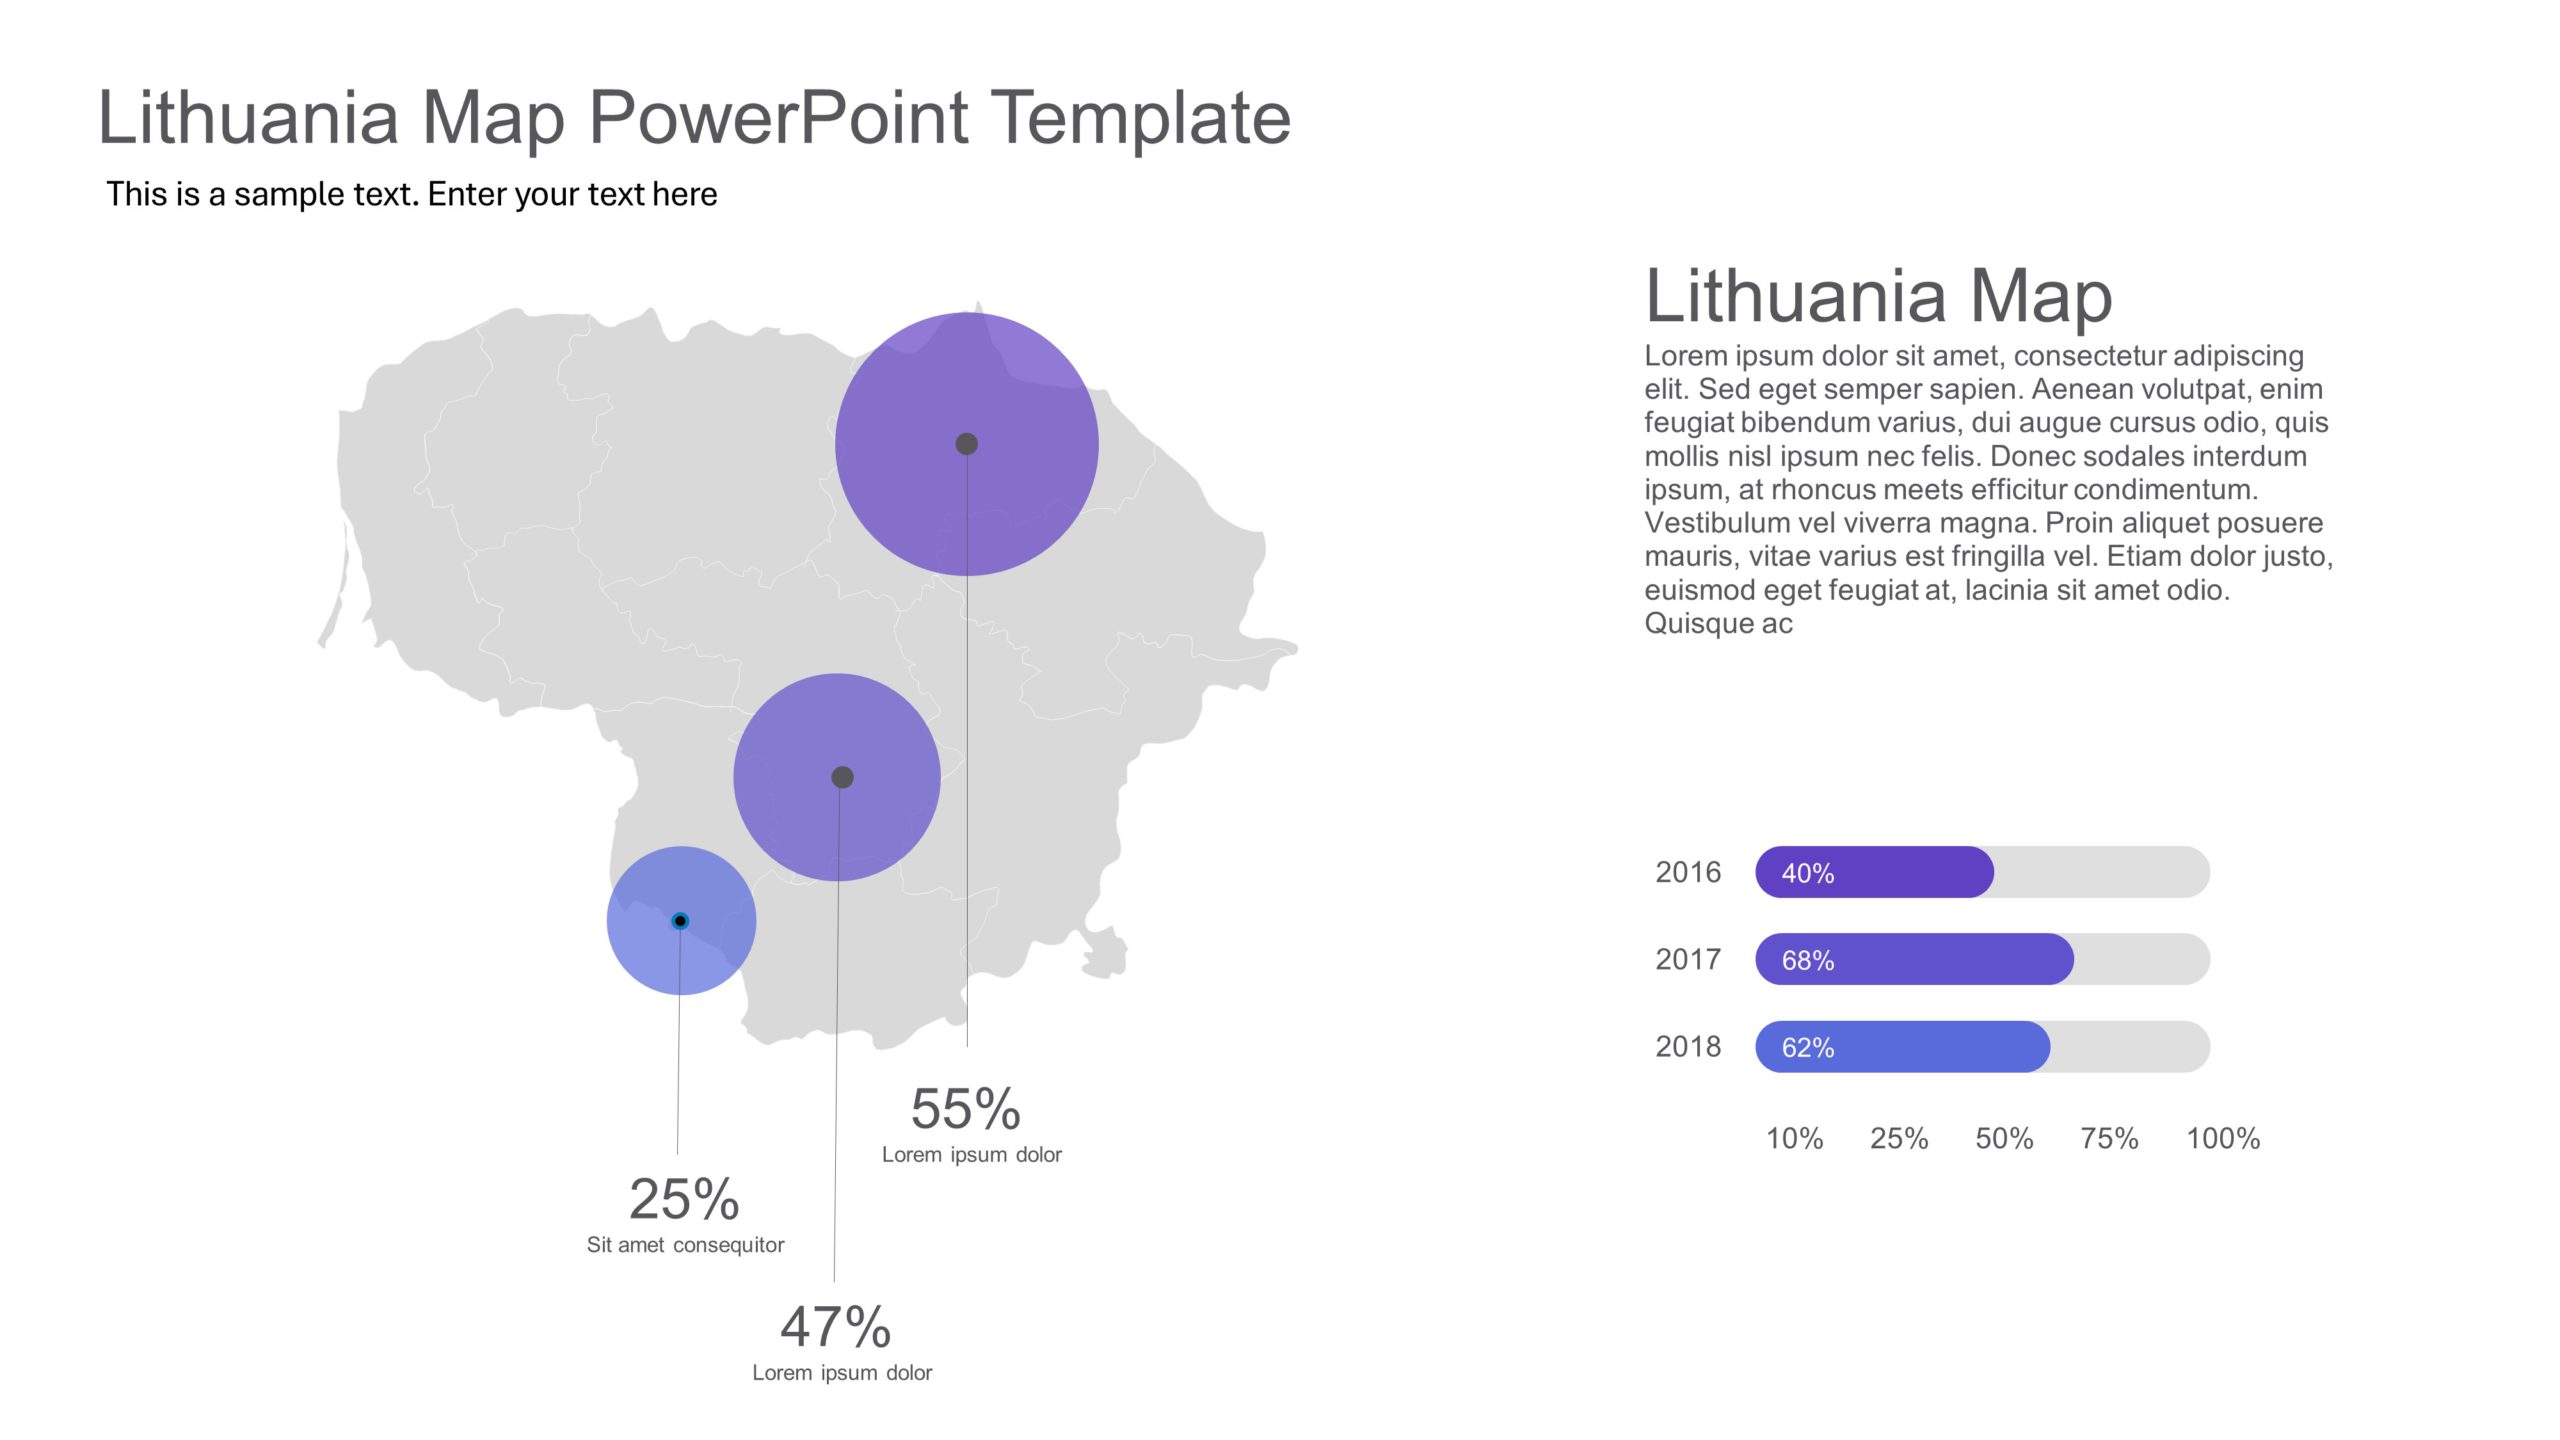
Present your vision with this engaging map template designed to showcase data insights in Lithuania. This visually appealing slide features a sleek map layout complemented by vibrant purple data circles, making it perfect for highlighting key statistics and trends.
Ideal for business analysts, marketing teams, or educators, this template allows you to effectively communicate important information about various regions in Lithuania. The clear, easy-to-read infographics provide a quick glance at data points, ensuring your audience grasps the essential details at a glance.
With a well-structured layout, you can seamlessly present your findings from 2016 to 2018, showcasing growth or changes over the years. The combination of the map and data visualization makes it a powerful tool for strategic planning, market analysis, or educational presentations.
Download now and elevate your presentations with this professionally designed template! Find more such Map PowerPoint templates for engaging presentations. These templates are compatible with both PowerPoint and Google Slides.


