Flat 4


 Edit with AI
 Ask Us To Edit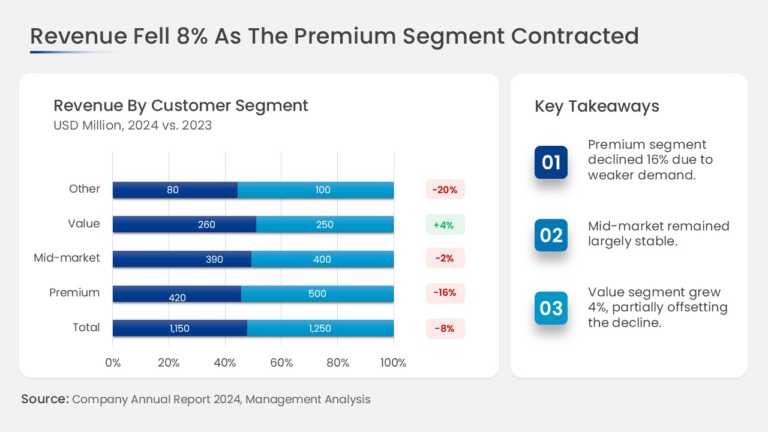

Product Description:
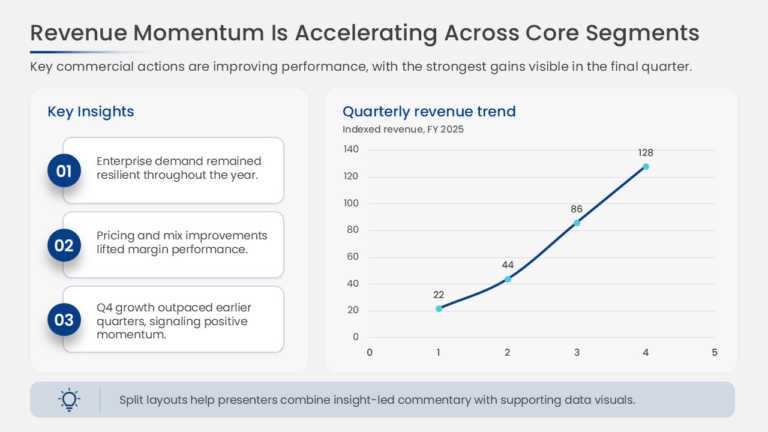
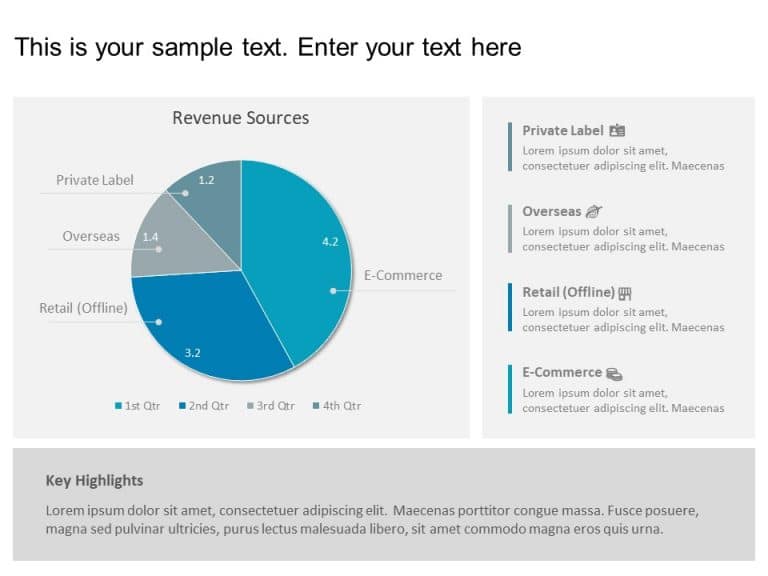
This slide combines a revenue chart broken down by business segment with a dedicated key takeaways panel. The chart area shows the revenue contribution of each segment, and the adjacent panel holds concise insight statements that explain what the numbers mean.
A CFO or FP&A Manager can use this slide in a quarterly earnings review to show which segments drove revenue and call out the conclusions leadership should act on. Placing the data and the interpretation side by side reduces the need for verbal explanation.
Explore more sales analysis templates, or read our guide on telling a story with data. This template is fully editable and compatible with PowerPoint and Google Slides.