Flat 4


 Edit with AI
 Ask Us To Edit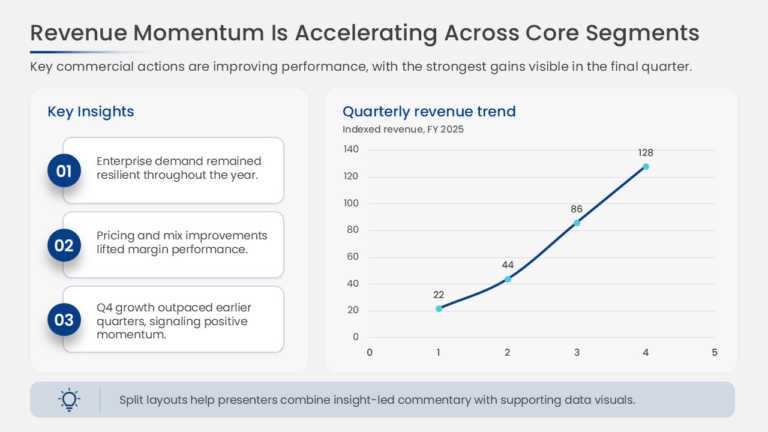

Product Description:
This slide charts revenue across quarters to show period-over-period growth and pairs the chart with insight callouts that explain the drivers behind each change. The combined layout presents both the numbers and the narrative on one slide.
A Sales Director or Revenue Operations Manager can use this slide in a quarterly business review to show revenue progression and highlight the wins or risks behind the trend. Leadership gets the result and the explanation without flipping between slides.
See more QBR templates, or read our guide on running a quarterly business review. This template is fully editable and compatible with PowerPoint and Google Slides.